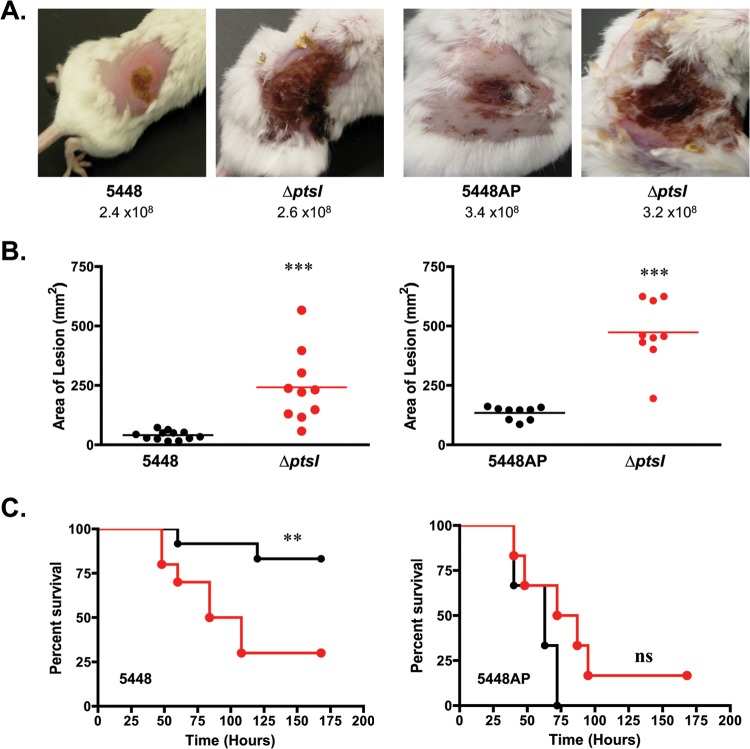
FIG 3.
ΔptsI mutants of additional M1T1 GAS strains. (A) Representative images of mice infected s.c. with strain 5448 (CovS+) and its ΔptsI mutant (left) or 5448AP (CovS−) and its ΔptsI mutant (right) at 38 h postinfection. The numbers of CFU used in infection are indicated. (B) Lesion sizes of the same strains measured at 38 h postinfection from a representative experiment (the total number of mice is 60). Each symbol represents the value for a single animal, with the horizontal bars indicating the mean values for groups. Statistical significance was determined by unpaired two-tailed t test. (C) Survival plot of mice infected with either wild-type 5448 and 5448AP in black and their corresponding ΔptsI mutants in red. Significance was determined by Kaplan-Meier survival analysis and log rank test (**, P ≤ 0.01; ***, P ≤ 0.001; NS, not significant).

