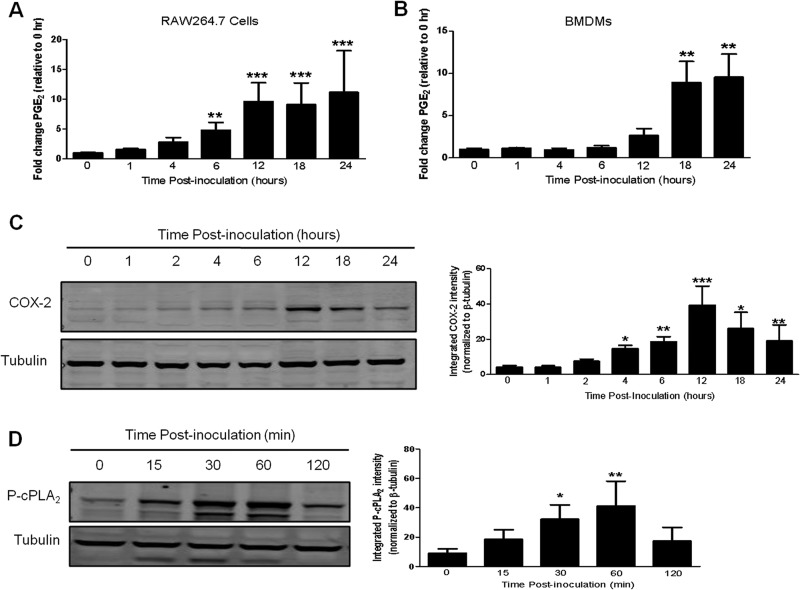
FIG 2.
F. tularensis infection of macrophages increases PGE2 synthesis, COX-2 protein levels, and cPLA2 phosphorylation. (A and B) RAW264.7 macrophages (A) or BMDMs (B) were inoculated with LVS at an MOI of 200:1. At 0, 1, 4, 6, 12, 18, and 24 h postinoculation, supernatants were collected, and PGE2 concentrations were determined. The data are the means and SEM from three independent experiments. (C) RAW264.7 macrophages were inoculated with LVS at an MOI of 200:1. At 0, 1, 2, 4, 6, 12, 18, and 24 h postinoculation, whole-cell lysates were collected and analyzed for COX-2 protein levels by Western blotting (left). The band intensities (right) were measured in each experiment using LiCor Odyssey infrared imaging system software and were normalized to the loading control (tubulin). The graph shows the band intensities from three independent experiments. (D) BMDMs were inoculated with LVS at an MOI of 200:1. At 0, 15, 30, 60, and 120 min postinoculation whole-cell lysates were collected and analyzed for cPLA2 phosphorylated on Ser505 by Western blotting (left). The band intensities (right) were measured in each experiment using LiCor Odyssey infrared imaging system software and were normalized to the loading control (tubulin).The graph shows the band intensities from three independent experiments. Statistical differences (*, P ≤ 0.05; **, P ≤ 0.01; ***, P ≤ 0.001) compared to the 0-h sample were determined by Dunnett's multiple comparison test.

