
FIG 5.
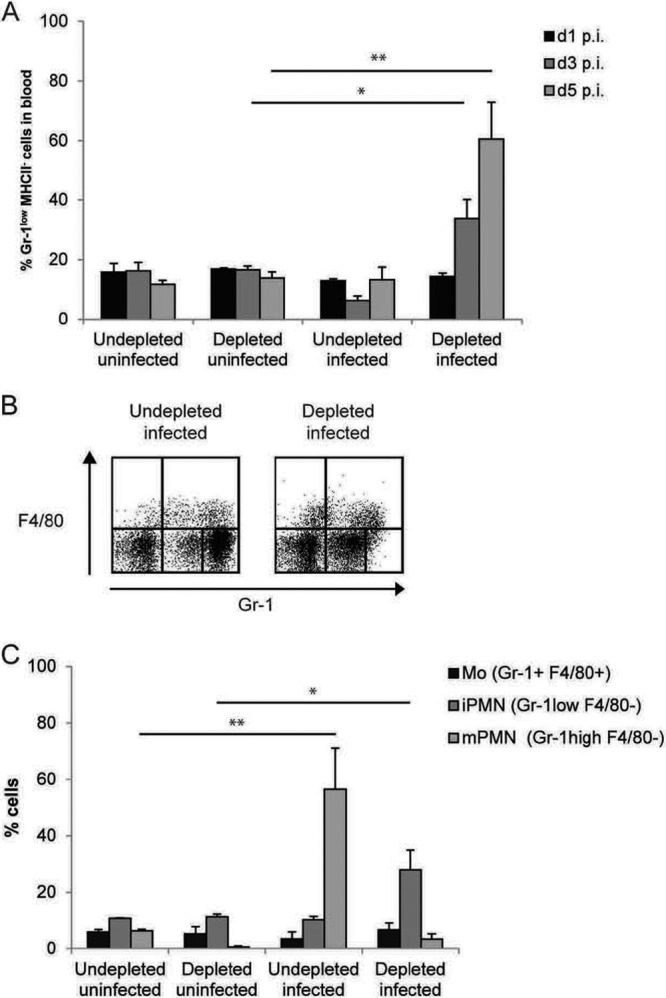
The proportion of Gr-1low MHC-II− cells increases in PMN-depleted mice infected with Y. pseudotuberculosis. Blood from undepleted and PMN-depleted mice, uninfected or infected with wt Y. pseudotuberculosis, was collected and was analyzed for the presence of Gr-1+ cells by flow cytometry. (A) Percentages of Gr-1low MHC-II− cells during the course of the experiment. Cellular expression of Gr-1 and MHC-II was determined by flow cytometry analysis. Data for gated Gr-1low MHC-II− cells are presented as means ± SD. (B) Representative dot plots from flow cytometry analysis performed on blood leukocytes to investigate the distribution of mature and immature PMNs and monocytes upon infection in undepleted and PMN-depleted mice. Blood leukocytes were isolated and were analyzed for the expression of Gr-1 and F4/80. Monocytes were identified as Gr-1+ F4/80+ cells (upper right quadrants), immature PMNs as Gr-1low F4/80− cells (lower middle quadrants), and mature PMNs as Gr-1high F4/80− cells (lower far right quadrants). (C) Different Gr-1+ cell types in blood from undepleted and depleted mice, uninfected or infected with wt Y. pseudotuberculosis, at day 5 postinfection. The flow cytometry analysis used gates to separate Gr-1+ cells into monocytes (Mo), immature neutrophils (iPMNs), and mature neutrophils (mPMNs) on the basis of their expression of Gr-1 and F4/80. Data are presented as means ± SD. Differences between groups were analyzed by an unpaired Student t test, with significance set at P values of <0.05 (*), <0.01 (**), or <0.001 (***).