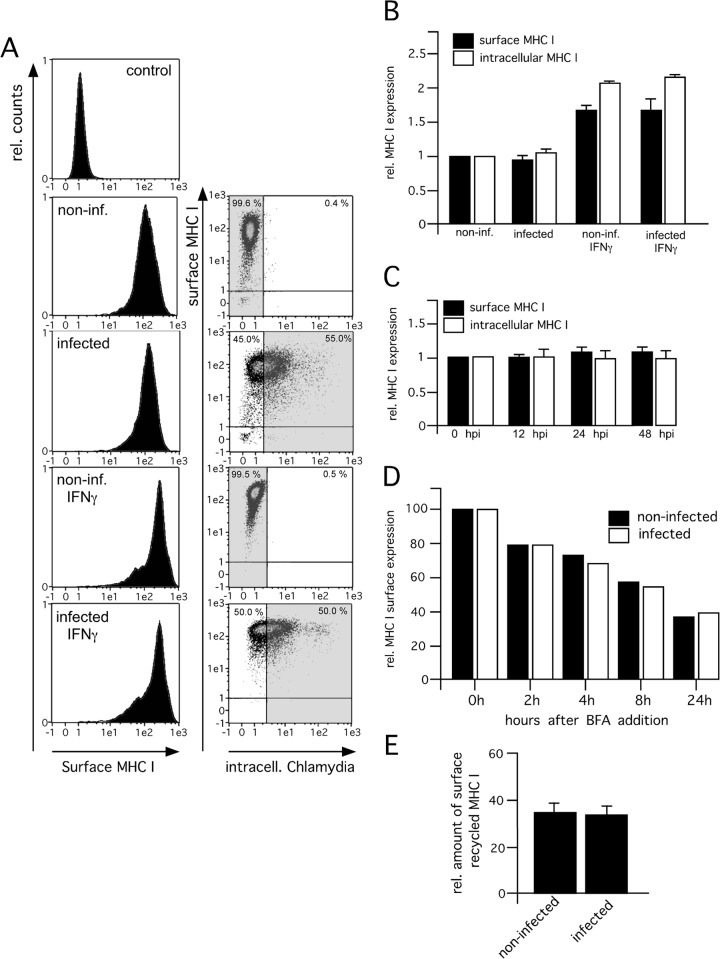
FIG 5.
MHC I surface presentation properties of infected (inf.) and noninfected HeLa cells in the absence or presence of IFN-γ. (A) Analysis of surface-expressed MHC I. Infected (48 hpi) and noninfected HeLa cells were costained for surface MHC I (red fluorescence) and intracellular Chlamydia (green fluorescence). HeLa cells were treated with IFN-γ for 48 h prior to and for 48 h during infection with Chlamydia. The proper IFN-γ response of infected and noninfected cells was controlled via cytokine-mediated TAP1 induction analyzed by corresponding Western blot assays (not shown). Infected cells were identified by their green fluorescent intensity (right panel, dot plot analysis of MHC I fluorescence versus Chlamydia fluorescence). The histogram plots representing MHC I surface expression (left panel) were gated on the populations of Chlamydia-negative and -positive cells, respectively (indicated by gray areas in the respective dot plots, right panel). The topmost histogram in Fig. 5A represents an isotype control staining with a suitable mouse IgG2a κ MAb (BioLegend). The percentage of cells present in the upper and lower left quadrants is indicated at the top left of each plot, whereas the value at the top right represents the percentage of cells located within the upper and lower right quadrants. One representative result of three independent experiments is shown. Data from MHC I staining experiments (intracellular and surface-expressed MHC I) are summarized in panel B. Results are plotted as the relative (rel.) increase in mean fluorescence intensity compared with the mean fluorescence intensity in the control experiments. (C) Time course analysis of MHC I expression during chlamydial infection. HeLa cells infected for 0, 12, 24, and 48 h were stained for intracellular and surface-expressed MHC I. Results are plotted as the relative change in mean fluorescence intensity compared with the mean fluorescence intensity in the control experiments. (D) Survival of MHC I molecules on the cell surface. Transfectants were treated with BFA, which inhibits protein export from the ER. After the cells were cultured for different times, MHC I surface staining with W6/32 was performed. Flow cytometry results are presented as the percent reductions of the mean fluorescence intensities at 2, 4, 8, and 24 h compared with the mean fluorescence intensity at 0 h. (E) Endosomal recycling of surface MHC I in infected and noninfected HeLa cells. Cells were infected (48 hpi), and expression of surface MHC I in the presence or absence of primaquine was analyzed by flow cytometry. The reduction in the mean fluorescence intensity compared with the mean fluorescence intensity in the control experiments is plotted as a percentage of surface recycled MHC I.

