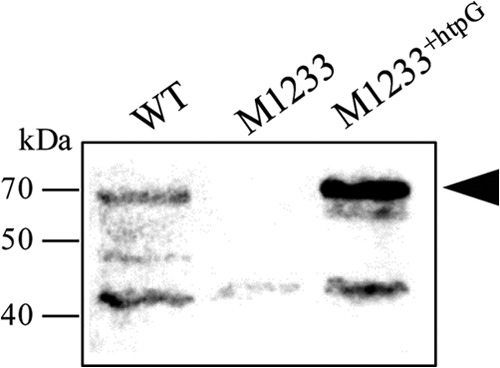
FIG 2.

Anti-HtpG immunoblot analysis of wild-type (WT), htpG mutant M1233, and complemented mutant M1233+htpG whole-cell lysates. The black arrowhead indicates the HtpG-specific band observed at 68 kDa. The positions of molecular mass markers are shown on the left.
