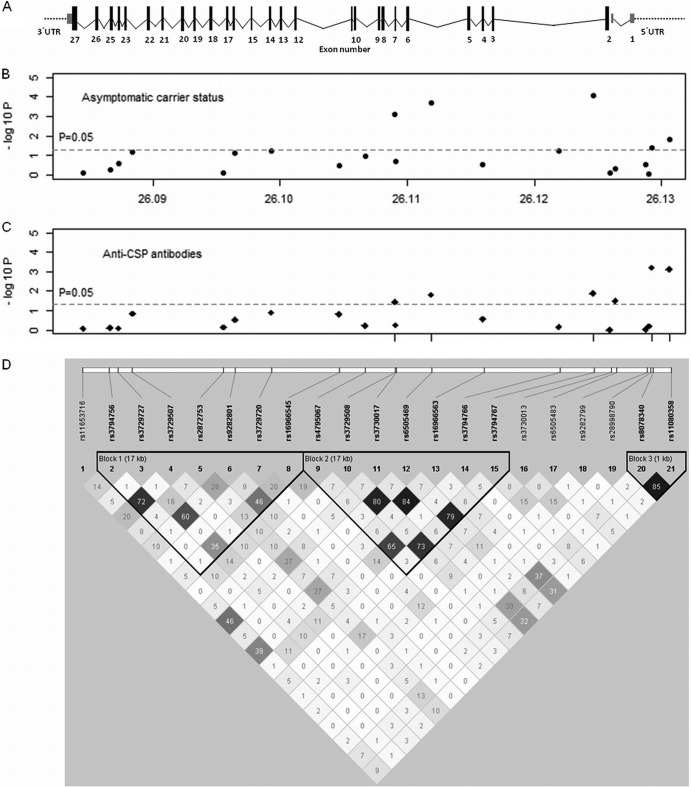
FIG 2.
Genetic association of NOS2 SNPs with asymptomatic malaria and anti-CSP antibodies in the Príncipe population. (A) NOS2 gene structure scaled diagram. Exons are represented by boxes and numbered. (B and C) Plots of association tests for the healthy carrier status under the log-additive model (B) and QTL analysis of anti-CSP antibody levels (C) for the represented SNPs. The results are presented as the −log10 of the P value. (D) LD map for the tested SNPs obtained using Haploview 4.2 (values represent pairwise r2).

