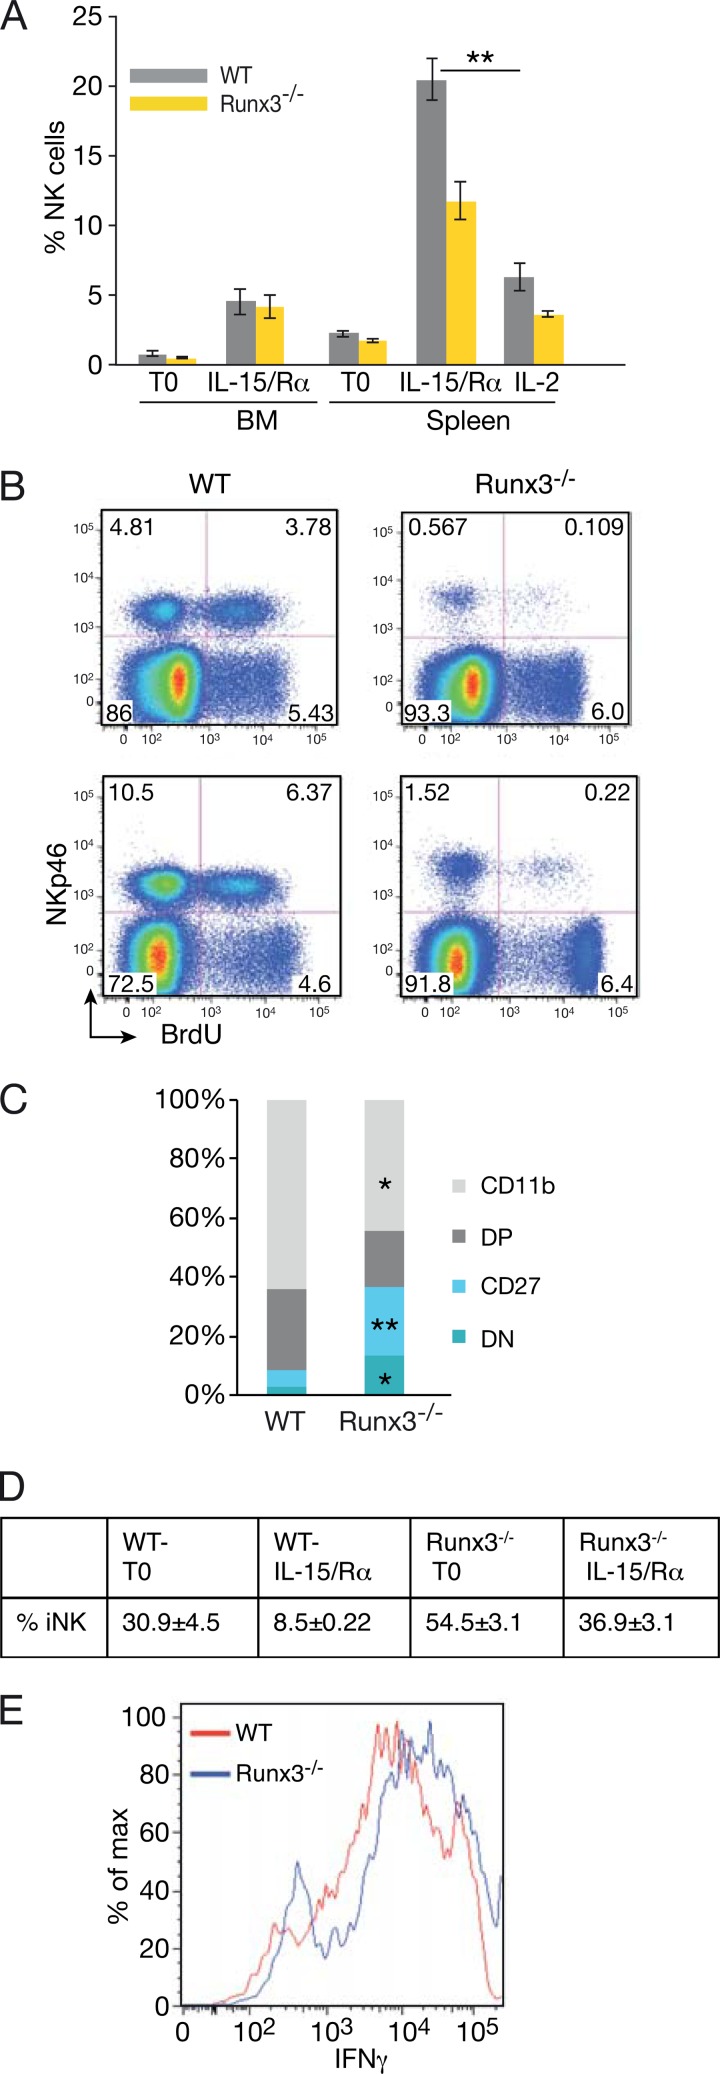
FIG 3.
Impaired accumulation of mature Runx3−/− splenic NKC following IL-15/Rα or IL-2 activation in vivo. (A) Percentages of NKp46+ NKC in WT and Runx3−/− BM and spleen under resting conditions (T0) (n = 8 and n = 12, respectively) and following injection of IL-15/Rα (n = 13 and n = 16, respectively) or IL-2 (n = 5). Significance: ∗∗, P < 0.001. (B) BrdU incorporation in BM (upper panels) and spleen (lower panels) NKC (NKp46+ cells) 24 h after the second IL-15/Rα injection. (C) Bar graphs showing the frequency of WT and Runx3−/− NKC subsets in spleen following IL-15/Rα activation. Mean values are shown for the four populations (n = 5). Significance, WT versus Runx3−/− NKC: ∗∗, P < 0.001; ∗, P < 0.005. (D) Impaired maturation of Runx3−/− NKC under resting and activated conditions. Percentages of iNK (CD27− CD11b− and CD27+ CD11b−) cells in WT and Runx3−/− spleen under resting conditions (T0) and following administration of IL-15/Rα. Significance: WT versus Runx3−/− at T0 and IL-15, P < 0.01. (E) IFN-γ production by WT and Runx3−/− spleen NKC following IL-15 activation in vivo.

