FIG 8.
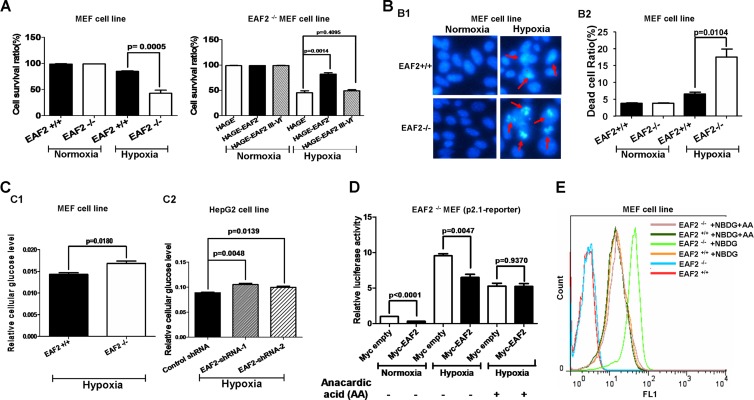
EAF2 protects against hypoxia-induced cell death and inhibits cellular uptake of glucose under hypoxic conditions. (A, left) Under hypoxic conditions (1% O2 for 24 h), EAF2+/+ MEFs had a significantly higher cell survival rate than EAF2−/− MEFs (P = 0.0005). (Right) Under hypoxic conditions (1% O2 for 24 h), overexpression of full-length EAF2 in EAF2−/− MEFs enhanced the cell survival rate (P = 0.0014), but overexpression of domains III to VI of EAF2 did not do so (P = 0.4095). Cells were counted using a Bio-Rad cell counter after trypan blue staining. (B1) The representative pictures of EAF2+/+ and EAF2−/− MEFs stained with Hoechst 33342 after treatment by normoxia (21% O2) or hypoxia (1% O2) for 24 h. The dying cells are marked by arrows. (B2) Quantitative analysis for Hoechst staining. EAF2−/− MEFs had a significantly higher dead cell ratio than EAF2+/+ MEFs (P = 0.0104). Data are means and SEM representing nine randomly selected fields of three wells in a six-well plate. (C1) EAF2−/− MEFs had significantly higher intracellular glucose levels than EAF2+/+ MEFs. The glucose level was measured by a glucose assay kit (BioVision). (C2) Knockdown of EAF2 in HepG2 cells caused an increase in cellular uptake of glucose under hypoxia (P = 0.0048 and P = 0.0139). (D) Inhibition of p300 activity abolished the suppressive role of EAF2 on p2.1 promoter luciferase activity in EAF2−/− MEFs (P = 0.9370 versus P = 0.0047). Anacardic acid (AA) was added to the culture medium (50 μM) for 18-h treatment. Data are means and SEM of three independent experiments performed in triplicate. (E) Anacardic acid treatment (50 μM) abrogated the effect of EAF2 on cellular glucose uptake. Without anacardic acid treatment, EAF2−/− MEFs had higher intracellular glucose levels than EAF2+/+ MEFs (green curve versus orange curve). With anacardic acid treatment, the intracellular glucose levels in both EAF2−/− MEFs and EAF2+/+ MEFs dropped to the same level as that of EAF2+/+ MEFs without anacardic acid (AA) treatment (purple, dark green, and orange curves versus green curve). Glucose uptake was measured by FACS, following 1.5 h exposure to 2-NBDG (100 μM).

