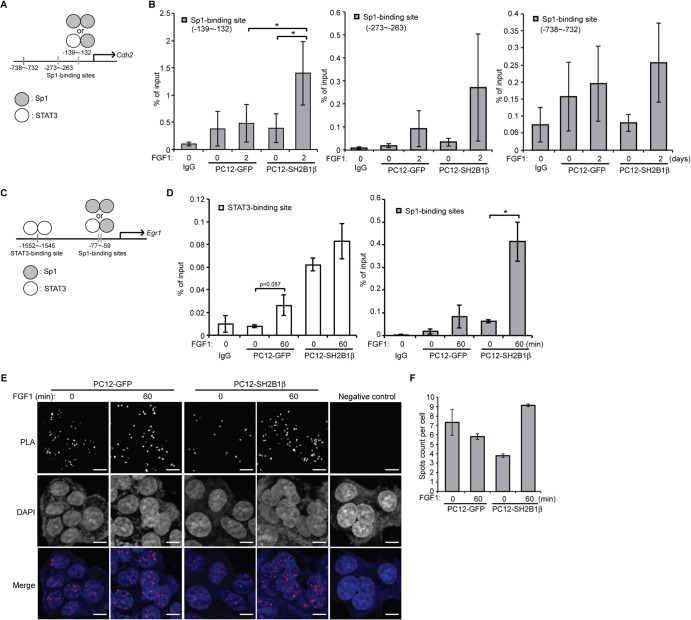
FIG 7.
SH2B1β enhances in vivo STAT3-Sp1 occupancy at the Cdh2 and Egr1 promoter. (A) Diagram of the Cdh2 promoter region containing three Sp1-binding sites. (B) PC12-GFP and PC12-SH2B1β cells were incubated in serum-free medium overnight before 100 ng/ml FGF1 treatment for 2 days. Cells were cross-linked, followed by ChIP analysis using either anti-IgG or anti-STAT3 antibody for immunoprecipitation. The immunoprecipitated DNA was analyzed by qPCR with specific primers flanking three Sp1-binding sites within the Cdh2 promoter. Values are the means ± SEM from four independent experiments. (C) Diagram of the Egr1 promoter region containing the STAT3-binding site or Sp1-binding sites. (D) PC12-GFP and PC12-SH2B1β cells were incubated in serum-free medium overnight before 100 ng/ml FGF1 treatment for 1 h. Cells were cross-linked, followed by ChIP analysis using either anti-IgG or anti-STAT3 antibody for immunoprecipitation. The immunoprecipitated DNA was analyzed by qPCR with specific primers flanking the STAT3-binding site or Sp1-binding site within the Egr1 promoter. Values are the means ± SEM from three independent experiments. *, P < 0.05 by paired Student's t test. (E) PC12-GFP and PC12-SH2B1β cells were incubated in serum-free medium overnight before being left untreated or treated with 100 ng/ml FGF1 for 1 h. Primary mouse anti-STAT3 and rabbit anti-Sp1 antibodies were combined with Duolink PLA mouse minus and PLA rabbit plus probes. Cells incubated with Duolink PLA probes only served as the negative control. Images were taken using an LSM 780 confocal fluorescence microscope. The STAT3-Sp1 heterodimers were detected as spots of PLA signal. Nuclear material was stained by DAPI. Scale bar, 5 μm. (F) Quantification of PLA spots counted by Blobfinder software and calculated from two independent experiments. Values are means ± standard deviations.

