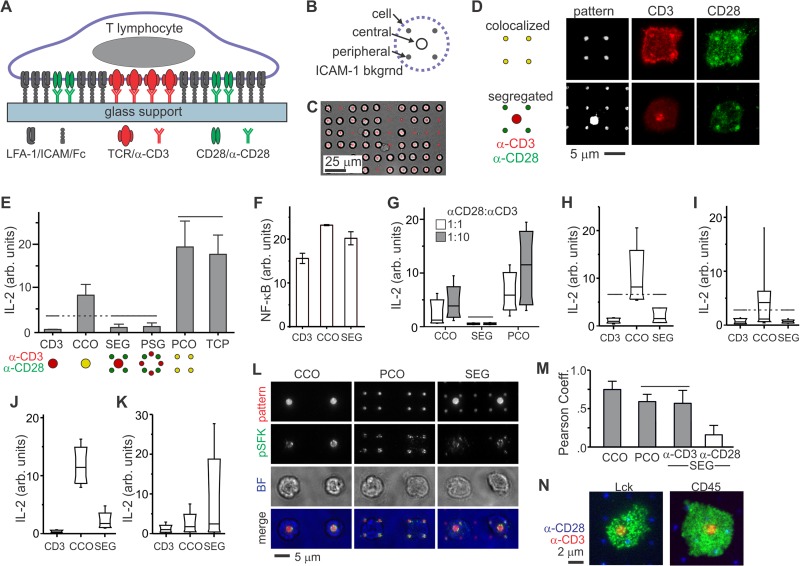
FIG 1.
Primary human CD4+ T cells from peripheral blood sense the microscale separation of CD3 and CD28 signaling. (A) Micropatterned surfaces provide control over the molecular organization of an artificial synapse. (B) Layout of an individual costimulation site. (C) Long-range arraying of primary human T cells on micropatterned surface, 30 min after initiation of cell-surface contact. (D) Local, microscale control over the layout of TCR (CD3) and CD28 within artificial immune synapses by patterning of anti-CD3 (OKT3) and anti-CD28 (9.3). These cells were fixed and stained 30 min after initiation of cell-surface contact. (E) IL-2 secretion was curtailed by separation of CD3 and CD28 engagement by micrometer-scale distances. TCP = antibody coated tissue culture plastic. The data are means ± the SD from >2,000 cells per surface (n = 5 independent experiments) and were compared by using ANOVA/Tukey methods; overbars group conditions that are not statistically different (α = 0.05). (F) Translocation of NF-κB in response to surface patterning. The data represent mean ± the SD. from three independent experiments, representing 17 to 25 cells per sample. Each condition was statistically different from all others (ANOVA/Tukey multiple comparison, α = 0.05). (G) Changing the relative concentrations of OKT3 and 9.3 in the micropatterning process did not alter the sensitivity of human CD4+ T cells to segregated costimulation. The standard ratio of OKT3 to 9.3 is 1:3. The data are box plots from a representative experiment, representing more than 2,000 cells per surface, and compared using ANOVA/Tukey methods (α = 0.05). (H and I) Replacing OKT3 with HIT3a (H) or 9.3 with CD28.6 (I) did not change the sensitivity of cells to segregated patterns. The data are box plots from representative experiments (n > 2,000 cells for each condition) and were analyzed using Kruskal-Wallis/Tukey methods (α = 0.05). (J and K) Comparison of IL-2 secretion by CD4+ T cells from human umbilical cord blood (J) and mouse peripheral blood (K). The data represent >2,000 cells for each condition from a representative experiment. Within each experiment, each condition was statistically different from all others, as analyzed using Kruskal-Wallis/Tukey methods (α = 0.05). (L) Activated Lck in primary human CD4+ T cells is tightly associated with features of anti-CD3. Cells were stained 15 min after initiation of cell-substrate contact. Pattern, anti-CD3 and anti-CD28; pSFK, anti-pY394; BF, bright field. (M) Quantitative comparison of pLck correlation with anti-CD3 and anti-CD28. The data represent means ± the SD for 10 to 15 cells on each pattern. The data were analyzed by ANOVA/Tukey methods (α = 0.05). (N) Total Lck and CD45 were uniformly distributed across the cell-surface interface. These representative cells were fixed 15 min after substrate contact.

