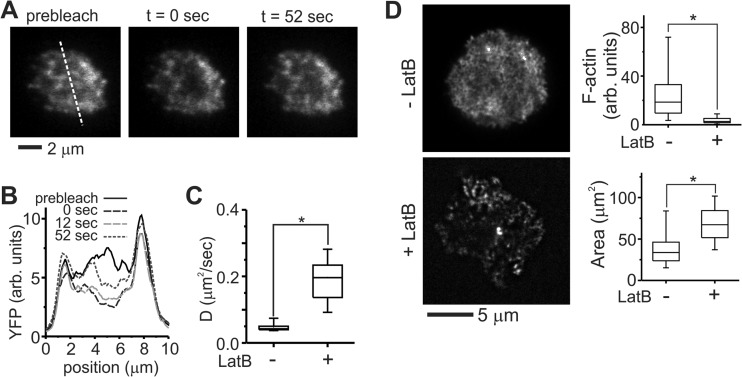
FIG 2.
The IS cytoskeletal network hinders mobility of membrane proteins. (A) The long-range diffusion coefficient of Lck was estimated by FRAP. This series of images illustrates the distribution of Lck-YFP before, immediately after, and 52 s after photobleaching. (B) Line profiles of Lck-YFP taken across the dotted line indicated in panel A, illustrating recovery of Lck-YFP. (C) Comparison of long-range Lck-YFP mobility in human CD4+ T cells with or without wash-in of 1 μM LatB. The data are box plots from a representative experiment, 7 to 15 cells per condition, and were compared using Kruskal-Wallis methods (*, P < 0.005). (D) LatB treatment disrupted a dense F-actin network at the cell-substrate interface. Cells were fixed 30 min after seeding. Each image was individually adjusted for brightness and contrast to allow visualization of F-actin structures and are thus not comparable on a quantitative basis. F-actin staining is compared quantitatively in the top graph, whereas the lower one compares cell spreading in response to LatB wash-in. The data for both graphs are box plots from a representative experiment, >17 cells per condition. The data were compared using Kruskal-Wallis methods (*, P < 0.005).

