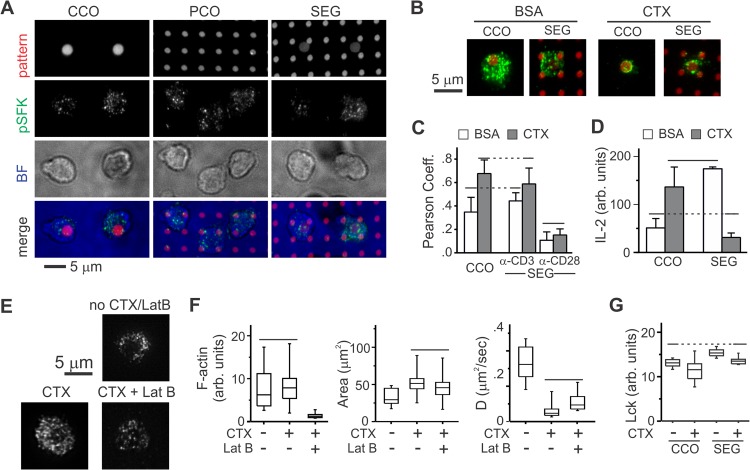
FIG 4.
The response of primary mouse cells to micropatterned costimulation is consistent with a diffusion-based model. (A) Staining for pSFK in primary mouse cells is spread across the cell-substrate interface. Cells were fixed 15 min after contact with the substrate. Pattern, anti-CD3 and anti-CD28; pSFK, anti-pY394; BF, bright field. (B) Inclusion of CTX on the substrate surface increases localization of pSFK to anti-CD3 features. In these images, anti-CD3 and anti-CD28 in the CCO and SEG patterns are shown in red, whereas pSFK is in green. (C) Quantitative comparison of the effect of CTX on localization of pSFK. The data are means ± the SD from 10 to 15 cells per condition and were compared by ANOVA/Tukey methods (α = 0.05). (D) Comparison of IL-2 secretion as a function of pattern and CTX. The data are means ± the SD across three experiments, which were analyzed using ANOVA/Tukey methods (α = 0.05). (E) Actin structure as a function of surface-immobilized CTX and LatB wash-in. These images were individually adjusted for brightness and contrast to allow visualization of F-actin structures. (F) Quantitative comparison of F-actin staining intensity, cell spreading, and Lck-YFP diffusion coefficient as a function of CTX and LatB. In each representative experiment, data are from 8 to 16 cells per surface and were compared using Kruskal-Wallis/Tukey methods (α = 0.05). (G) Comparison of average Lck signal in the cell-substrate interface as a function of pattern and CTX inclusion. The data for this representative experiment are from 12 to 49 cells per condition and were compared using ANOVA/Tukey methods (α = 0 0.05).

