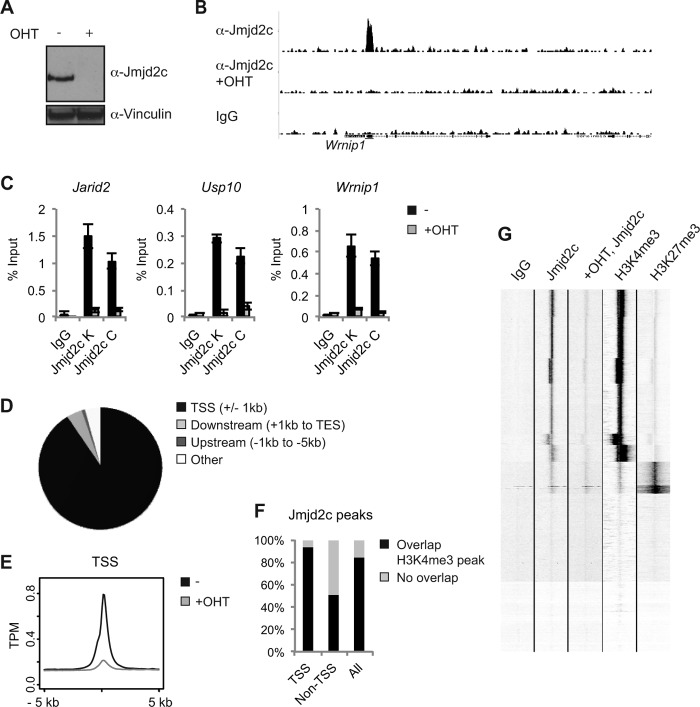
FIG 4.
Jmjd2c localizes to H3K4me3-positive transcription start sites in MEFs. (A) Western blot of control (−) and OHT-treated Jmjd2c knockout MEFs. (B) Examples of ChIP-seq tracks. (C) Independent ChIP validations. Anti-Jmjd2c C was used for the ChIP-seq experiment. (D) Diagram illustrating the overall distribution of identified Jmjd2c peaks relative to TSSs and coding regions. (E) Density plot displaying average Jmjd2c tag distributions relative to TSSs. The y axis shows mean tags per million (TPM). (F) Unsupervised clustering of ChIP-seq tags for IgG, Jmjd2c, H3K4me3, and H3K27me3 within 5 kb up- or downstream of TSSs. H3K4me3 and H3K27me3 ChIP-seq data for MEFs were obtained from reference 38. (G) Bar graph showing the percentages of Jmjd2c peaks displaying at least a 1-bp overlap with an H3K4me3-positive region as identified by MACS2 analyses of H3K4me3 ChIP-seq data from reference 38.

