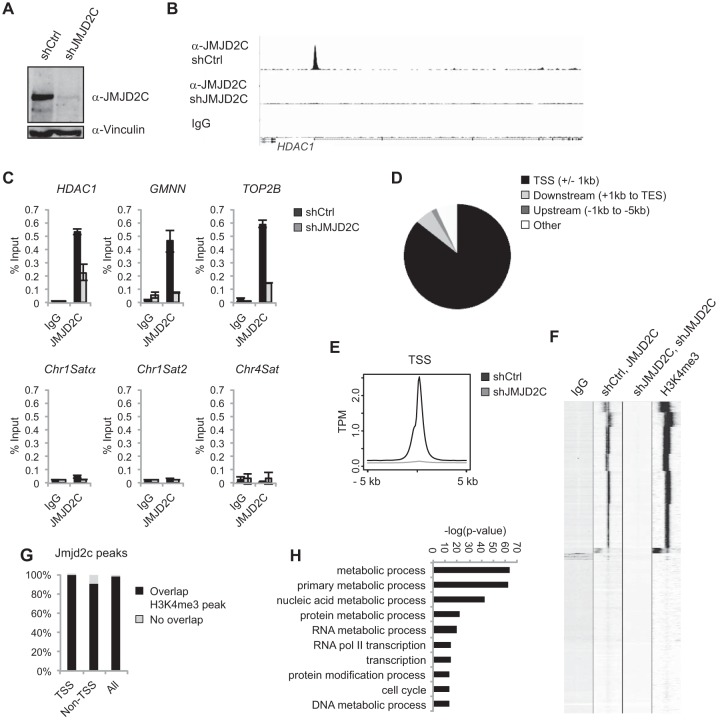
FIG 5.
JMJD2C localizes to H3K4me3-positive transcription start sites in the human cancer cell line KYSE150. (A) Western blot of KYSE150 cells transfected with a scrambled shRNA (shCtrl) or shRNA against JMJD2C (shJMJD2C). (B) Examples of ChIP-seq tracks. (C) Independent ChIP validations. HDAC1, GMNN, and TOP2B were identified as JMJD2C targets in the ChIP-seq analysis. (D) Diagram illustrating the overall distribution of identified JMJD2C peaks relative to TSS and coding regions. (E) Density plot showing average JMJD2C tag densities over TSSs. The y axis shows mean tags per million (TPM). (F) Heat map presenting unsupervised k-means clustering for ChIP-seq tag counts within 5 kb of TSSs. (G) Bar graph showing the percentages of JMJD2C peaks displaying at least a 1-bp overlap with an H3K4me3-positive region as identified by MACS2 analyses. (H) GO analysis of JMJD2C-bound genes in KYSE150 cells. The 10 most significantly overrepresented GO categories (biological function) are shown. Nucleic acid metabolic process is short for nucleobase, nucleoside, nucleotide, and nucleic acid metabolic process, and RNA Pol II transcription is short for transcription from the RNA polymerase II promoter.

