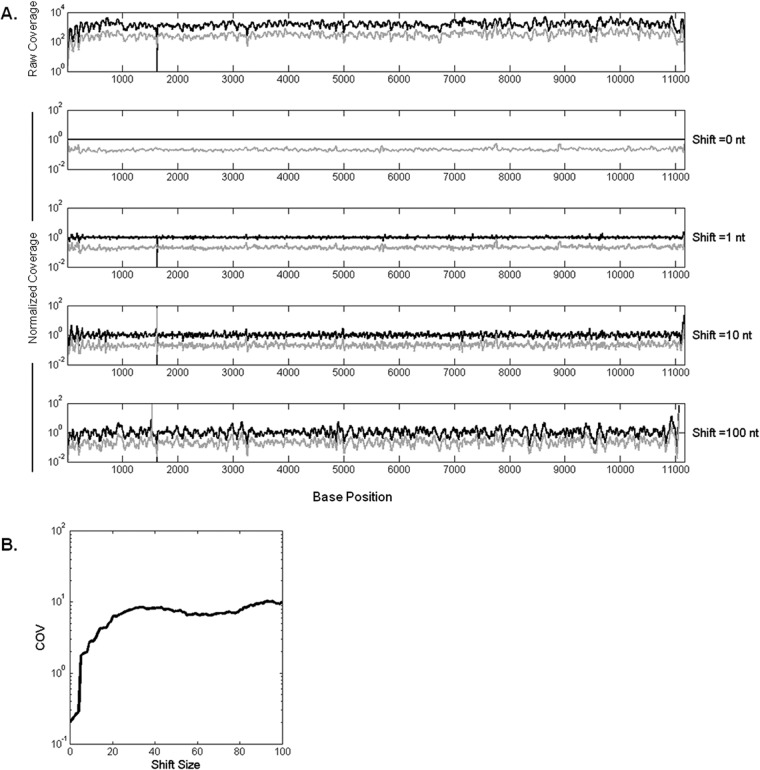
FIG 2.
Normalization by P0 coverage reduces variability. P1 coverage values are divided into P0 coverages at the corresponding positions shifted by an offset. (A) Normalized P0 (black curve) and P1 (gray curve) coverages with increasing offset from top to bottom. The x axis represents the nucleotide positions on the VSV genome. (B) As the reference P0 coverages are shifted by a higher offset, the noise in data increases, which can be seen in the increase of coefficient of variance (COV; calculated as the standard deviation of normalized coverages divided by the coverage mean across genome) of P1. The COV approaches its maximum after about 30 bases.

