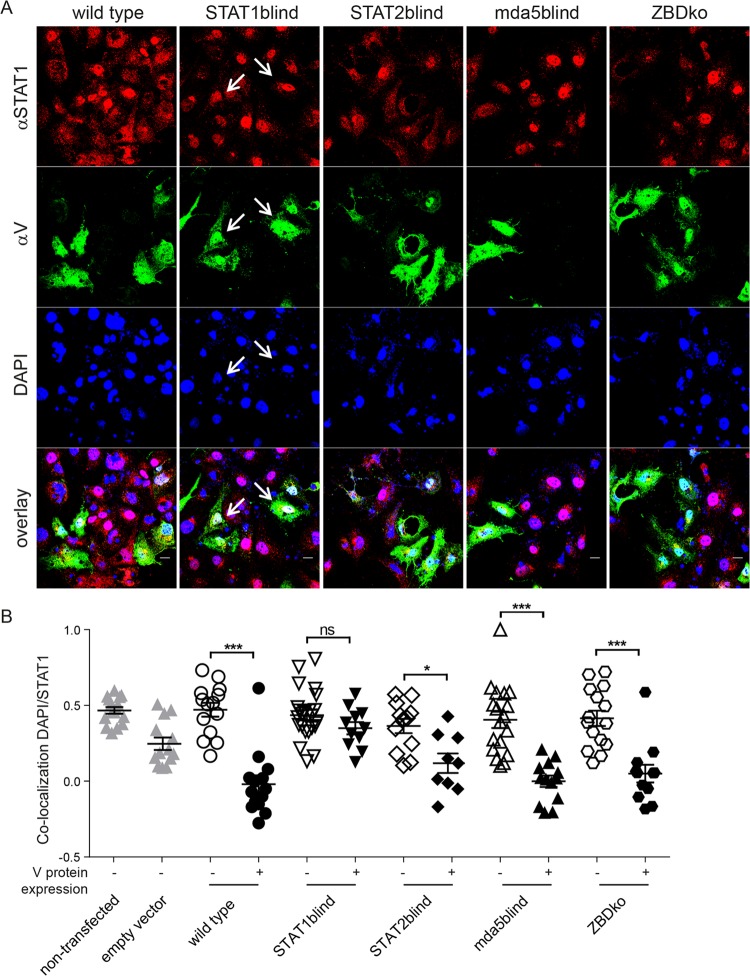
FIG 3.
Nuclear translocation of STAT1 in the presence of different V-protein mutants. V-protein-expressing Huh7 cells were treated with 2,000 U/ml IFN-γ for 30 min 36 h posttransfection. The cells were stained with an anti-phospho-STAT1 (αSTAT1) (C-111; Santa Cruz Biotechnology) monoclonal antibody (red) and a rabbit antipeptide hyperimmune serum against the P/V shared region (αV) (green). Nuclei were counterstained with DAPI (blue). (A) Confocal microscopic images at 600-fold magnification are shown. Colocalization is indicated by white arrows. (B) Single-cell analysis of DAPI/STAT1 colocalization after IFN-γ treatment of transfected versus nontransfected cells. Pearson's coefficients were calculated for nontransfected (open symbols) and transfected cells (closed symbols) in the same well. Each symbol represents the value for an individual cell; the mean (black horizontal line) and standard deviation (error bar) for each sample are indicated. Values around 0 indicate random protein distribution, while values above or below 0 represent colocalization or lack thereof, respectively. Nontransfected and vector controls are indicated by gray symbols. Symbols represent cells counted from at least 8 photos of two individual experiments (means ± SEM). The levels of statistical significance by one-way analysis of variance (ANOVA) with Bonferroni's multiple-comparison test are indicated above the bars as follows: *, P < 0.05; ***, P < 0.001; ns, no significance.

