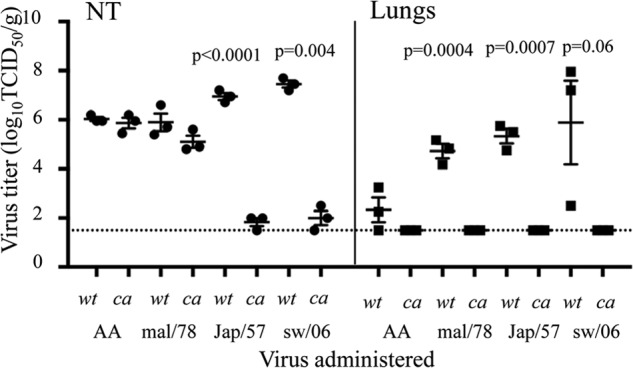
FIG 2.

Level of replication of each ca vaccine virus compared with the corresponding wt virus and compared with AA ca and AA wt viruses in the upper (NT, circles) and lower (lungs, square symbols) respiratory tracts of ferrets. Lightly anesthetized ferrets were inoculated intranasally with 107 TCID50 of each virus in a 0.2-ml volume, and tissues were harvested on day 3 postinfection. The dashed horizontal line represents the lower limit of detection. The P values from a t test are included above when significant differences were present.
