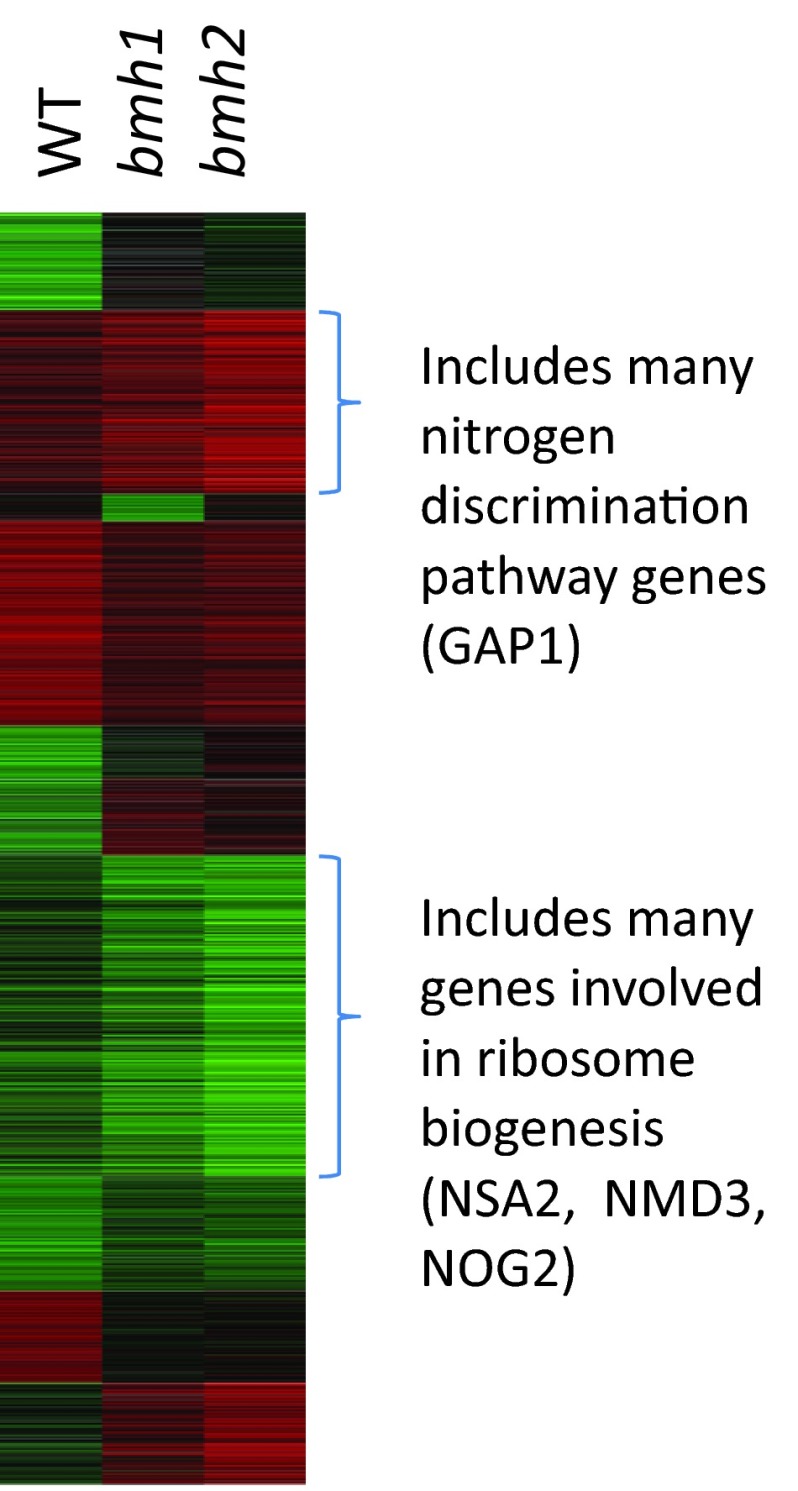
Figure 1. BMH1 and BMH2 regulate overlapping gene sets following treatment with rapamycin.
Log-transformed, averaged transcription profile data sets were clustered using k-means with the program Cluster [27]. The results are displayed with Treeview [27]. Red bars indicate genes that were transcriptionally induced, and green bars indicate genes that were transcriptionally repressed. The data set for each strain compares yeast treated with vehicle to those treated with rapamycin.

