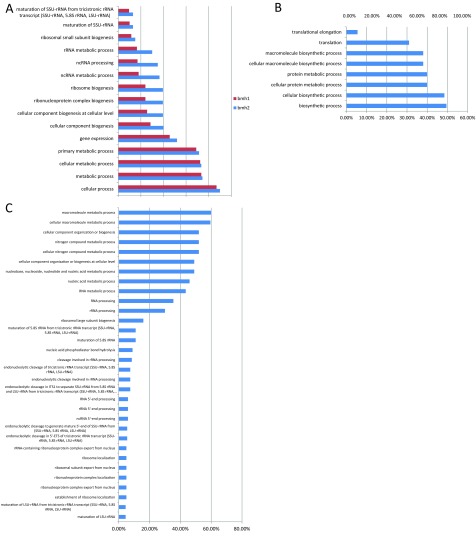
Figure 2. Gene ontology terms enriched (P<10−4) in the top 200 genes that are transcribed at lower levels in bmh1 cells or bmh2 cells than in WT cells following rapamycin treatment were determined.
(A) Enriched gene ontology terms in both bmh1 and bmh2 cells, (B) enriched gene ontology terms in only bmh1 cells and (C) enriched gene ontology terms in bmh2. The per cent of the 200 genes that map to each term is represented in each gene ontology bar.

