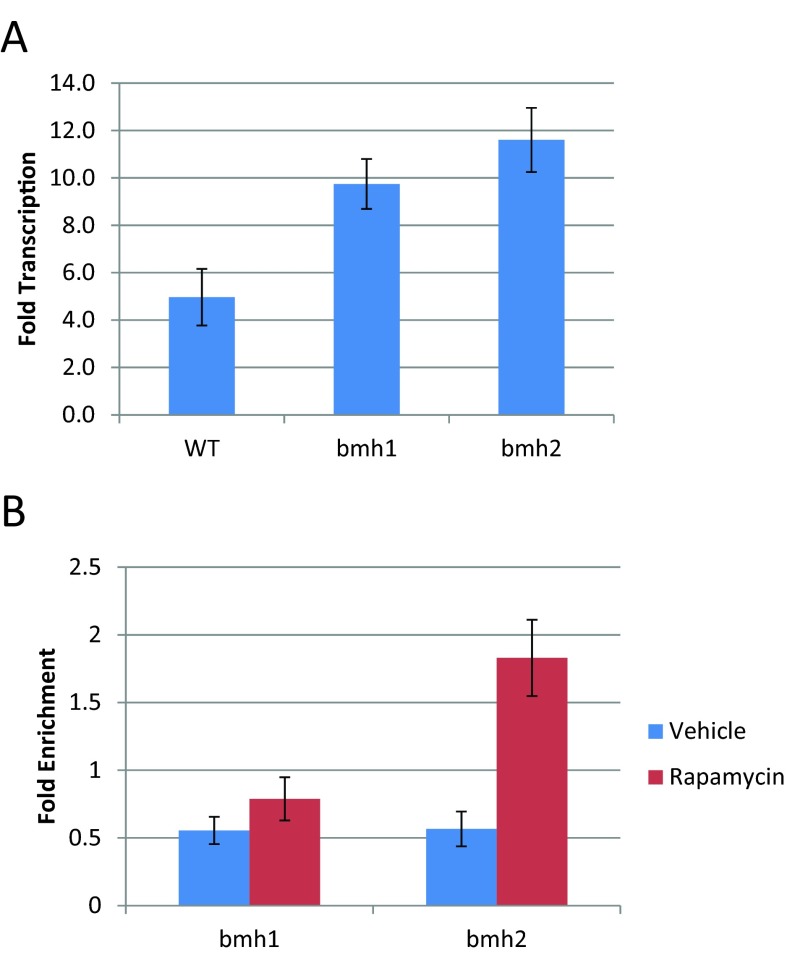
Figure 4. BMH2 but not BMH1 acts at the promoter of GAP1 to decrease its activation following rapamycin treatment.
(A) Quantitative RT-PCR was used to determine the transcriptional effect of treating the indicated yeast strain (WT, bmh1 and bmh2) with rapamycin. Each data point represents the abundance of GAP1 RNA in rapamycin-treated cells compared with vehicle-treated cells, relative to the RNA levels of TUB2. Error bars indicate the standard error of the mean (n=3). (B) ChIP followed by quantitative PCR was used to determine the extent to which Bmh1 and Bmh2 bind to the promoter of GAP1. Each data point represents the fold enrichment of the promoter of GAP1 after the immunoprecipitation compared with the whole cell extract, relative to the enrichment of the promoter of TUB2. Error bars indicate the standard error of the mean (n=4). Based on the microarray data, GAP1 is activated upon rapamycin treatment and deleting BMH1 or BMH2 increases that activation.

