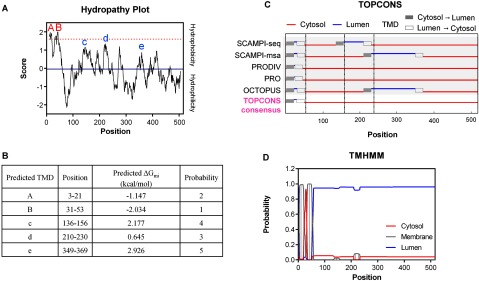
Figure 1. DHCR24 TMD and membrane topology predictions.

(A) A hydropathy profile of DHCR24 using the method of Kyte and Doolittle [15], returned by ProtScale with a window size of 19. The recommended threshold for the detection of TMDs is indicated by the dotted red line (1.6) [15], with peak regions of hydrophobicity above this marked in red (A and B). The GRAVY score is indicated by the solid blue line (−0.061). Predicted TMDs based on the apparent free energy difference for ER membrane insertion by the Sec61 translocon (ΔGmi) below the 1.6 threshold are marked in blue (c, d, e) (B) Putative TMDs and their probability based on ΔGmi [24]. (C) TMD predictions by the five TOPCONS algorithms: SCAMPI-seq and SCAMPI-msa [25], PRODIV and PRO [26] and OCTOPUS [27] and the TOPCONS global prediction (TOPCONS consensus) [25]. Potential TMDs are boxed grey (cytosol → lumen) or white (lumen → cytosol). Dotted grey lines indicate DHCR24 truncations, which are used in Figures 3–5. (D) DHCR24 membrane topology as predicted by the TMHMM server [16], with the probability of cytosol, membrane or lumenal location in red, grey or blue, respectively.
