
Figure 5. Phosphoacceptor substrate and ATP competitive inhibition of PKN3.
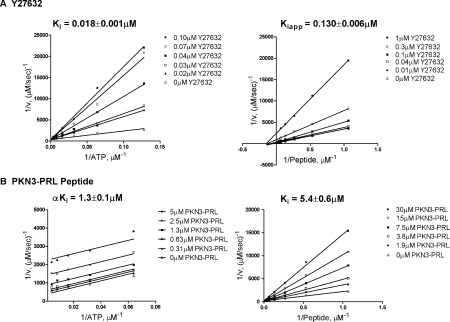
Lineweaver–Burk plots of 1/v versus 1/[ATP] or 1/v versus 1/[peptide] for PKN3 in the presence of ATP or phosphoacceptor substrate-competitive inhibitors using off-chip mobility shift assay, described in the Experimental section. (A) Initial velocities of PKN3 with 6 μM peptide substrate and 6.3–200 μM ATP (left); and with 250 μM ATP and 0.94–30 μM peptide substrate (right), with indicated concentration of Y27632, 4 nM enzyme and 5 μM arachidonic acid. (B) Initial velocities of PKN3 with 6 μM peptide substrate and 7.8–250 μM ATP (left); and with 250 μM ATP and 0.9–30 μM peptide substrate (right), with indicated concentration of PKN3-PRL peptide inhibitor, 4 nM enzyme and 5 μM arachidonic acid.