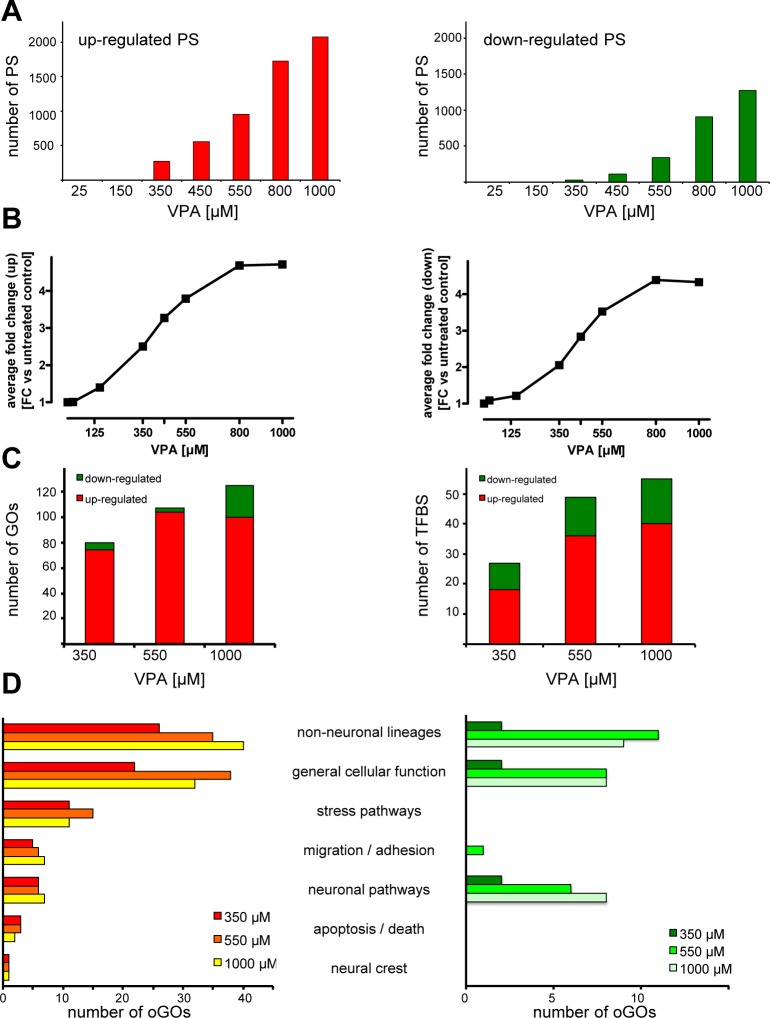
Figure 2.
Concentration-dependence of expression changes and biological grouping of probe sets after exposure to VPA. (A) Number of differentially expressed probe sets (PS) compared to the untreated control (p < 0.05, BY-corrected; fold change (FC) >2). Left panel (red) represents the amount of up-regulated PS and the right panel (green) the amount of down-regulated PS. (B) The PS identified in A to be regulated by 450 μM VPA (up, n = 554; down, n = 110) were examined for their regulation at all drug concentrations. The average FC of this set of up-regulated PS is shown in the left panel for different VPA concentrations; the data for the down-regulated PS are in the right panel. (C) Significantly up- and down-regulated PS and their potential upstream regulators were identified by bioinformatic approaches. The numbers of oGOs (left panel) and TFBS (right panel) are displayed for 350, 550, and 1000 μM VPA. Red represents the GO (left panel) and TFBS (right panel) overrepresented among up-regulated PS and green from down-regulated PS. (D) The oGOs determined in C were classified in superordinate cell biological processes by expert knowledge. The identified processes are given in the middle; the left panel refers to up- and the right panel down-regulated PS.

