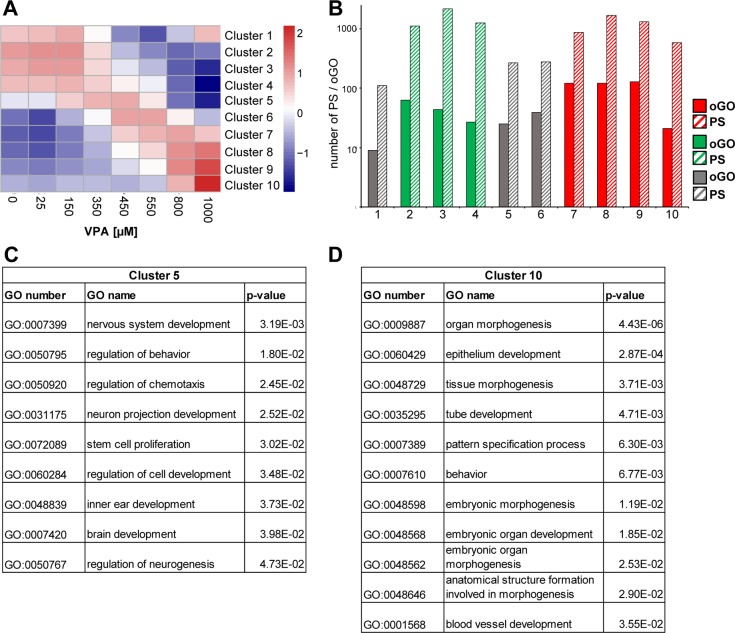
Figure 5.
Unbiased k-means clustering of concentration–response curves. (A) Display of the 10 clusters generated from different VPA concentration–response curves of the gene expression data sets. (B) The number of PS in each cluster (solid bars) and oGOs within each cluster (hatched bars) are displayed. Red, up-regulated; green, down-regulated; gray, nonmonotonic. (C, D) All oGOs containing less than 1000 genes are displayed for clusters 5 and 10.

