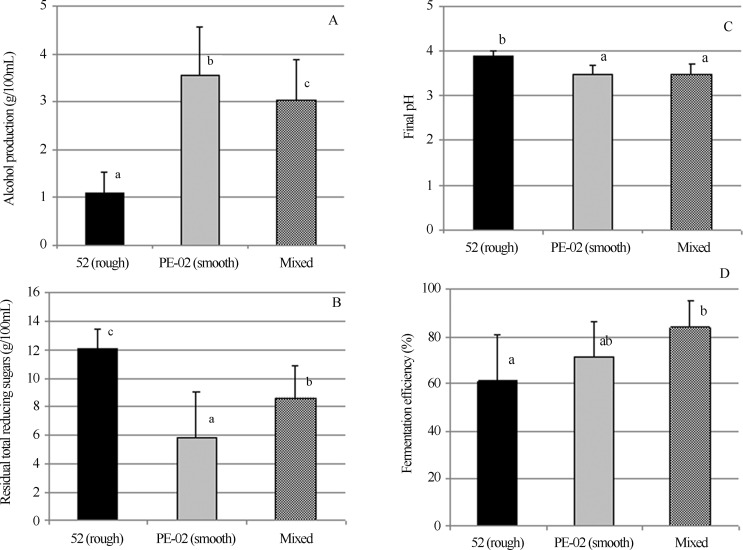
Figure 5.
Effect of the yeast strain (52, rough; PE-02, smooth; and mixed) on alcohol content (A), total reducing sugars (B), final pH (C) and fermentative efficiency (D) in fermentations carried out in sugar cane juice, 16% (w/v) total reducing sugars, pH 4.3, at 30 °C, over six 12-hfermentative cycles, with acid treatment of the yeast cells (at pH 1.5). Different letters above the bars denote significant differences at 5% by Tukeys test. The values are the means of six fermentative cycles.

