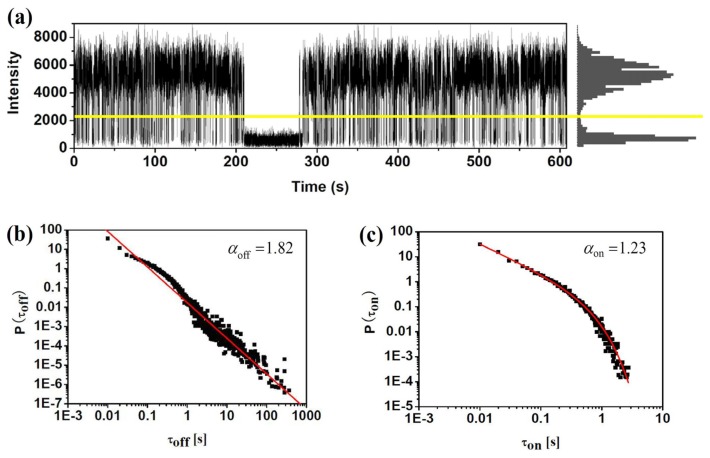
Figure 3.
(a) Fluorescence trajectory and intensity histogram of a single fluorophore, showing the assignment of the molecule to on and off states. The yellow solid line shows the threshold level chosen for the distinction between on and off states; (b) Histograms of “off” and “on” durations fitted by power law on the log-lot plots.

