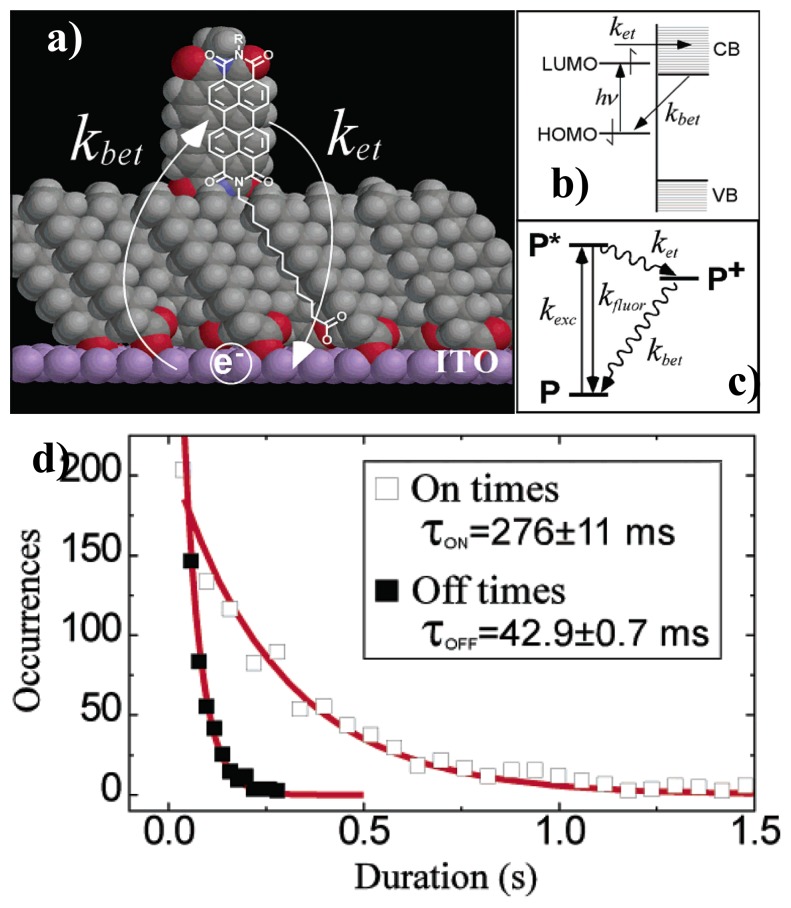
Figure 8.
(a) Scheme for interfacial ET; (b) and (c) Energy diagram for ET from perylene molecule to ITO; (d) Histogram and single-exponential fit for on and off duration times. Reprinted with permission from Ref. [62]. Copyright (2003) American Chemical Society.

