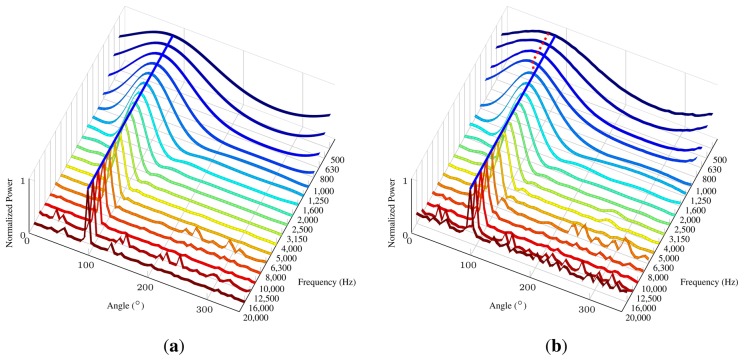
Figure 18.
Theoretical and experimental directionality graphs for the SoundCompass with a fixed source at 90° with a varying frequency from 500 till 20 kHz. The Blue line marks the 90° angle. The red dotted line marks the directionality obtained by the experiment. (a) The directionality graph for the SoundCompass according to our theoretical model; (b) the experimental directionality graph for the SoundCompass. Directionality in the lower frequencies deviates from the theoretical model.

