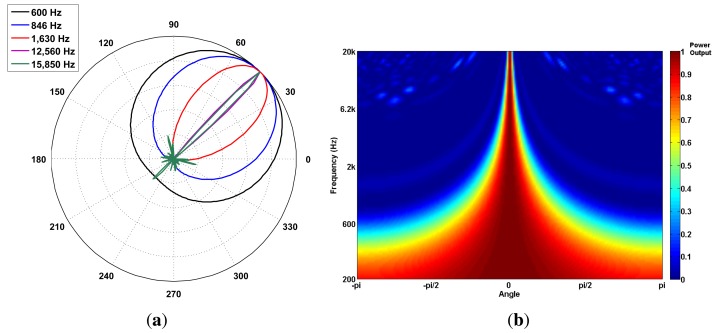
Figure 8.
The SoundCompass becomes more directive as the frequency of the measured sound source increases. (a) The SoundCompass polar responses at 600; 846; 1,630; 12,560 and 15,850 Hz (all sound sources have the same bearing of 45°) clearly show how the array’s main lobe becomes thinner and, therefore, more directive as the frequency of the sound source increases. (b) The waterfall diagram for the SoundCompass shows the power output of the array in all directions for all frequencies. It assumes that the incoming sound wave is at zero degrees. This diagram shows clearly how the directivity of the SoundCompass increases with frequency.

