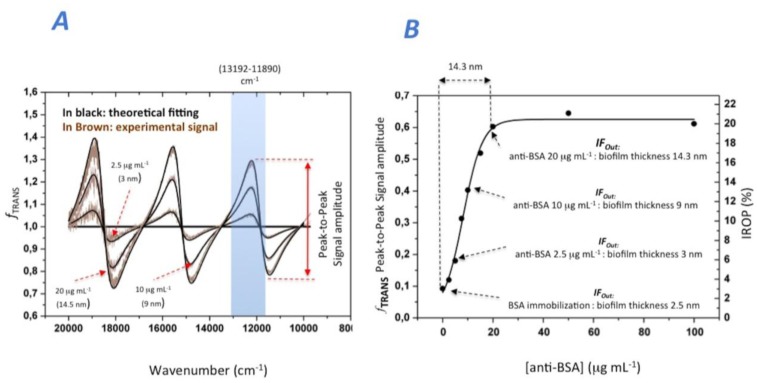
Figure 4.
Experimental response for measuring BSA / Anti-BSA immunoassay: (A) fTRANS response where in brown is represented the experimental signal and in black the theoretical fitting of the model. (B) Biosensing response starting with the immobilization of BSA and the increasing concentrations of anti-BSA.

