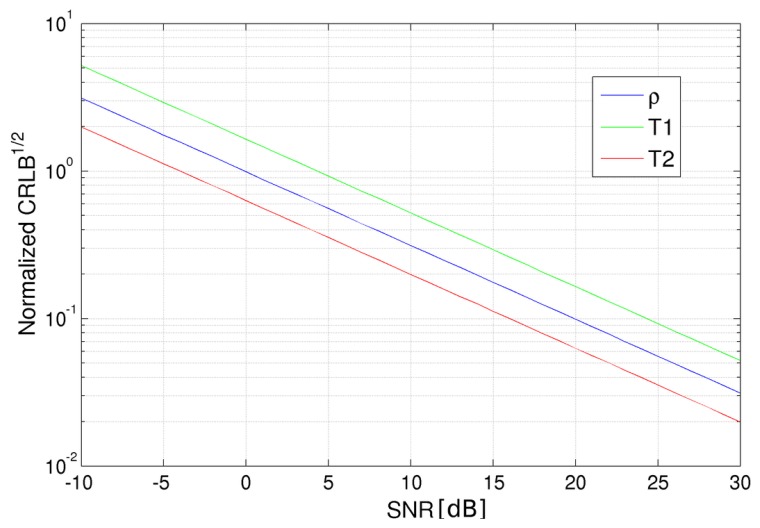
Figure 1.
Square root of the Cramer–Rao lower bound (CRLB) for proton density (blue), spin-lattice (T1) relaxation time (green) and spin-spin (T2) relaxation time (red) for different signal-to-noise ratio values expressed in decibels (logarithmic scale). CRLB values have been normalized for the parameter values in order to be plotted in the same graph.

