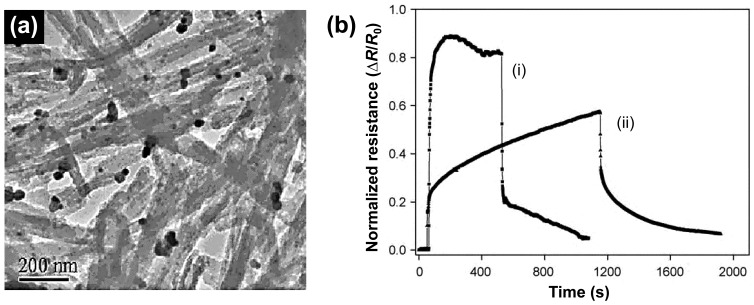
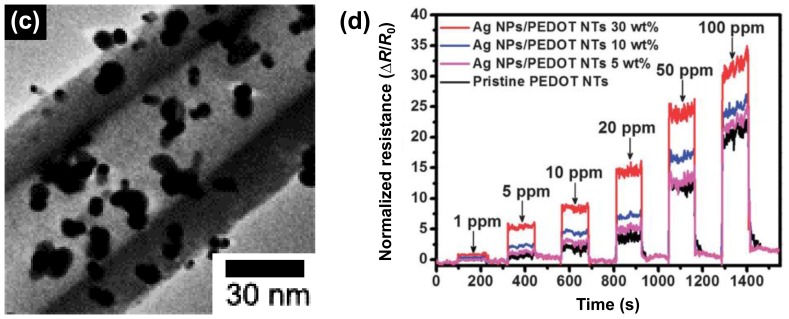
Figure 10.
(a) TEM image of PPy/Ag-AgCl nanotubes; (b) Response of (i) PPy nanotubes and (ii) PPy/Ag-AgCl nanotubes upon exposure to 100 ppm of NH3. Adapted with permission from Ref. [58]; Copyright 2010, Elsevier B.V; (c) TEM images of silver/PEDOT nanotubes; (d) The sensing performances toward 1–100 ppm NH3 gases. Adapted with permission from [59]; Copyright 2012, Royal Society of Chemistry.


