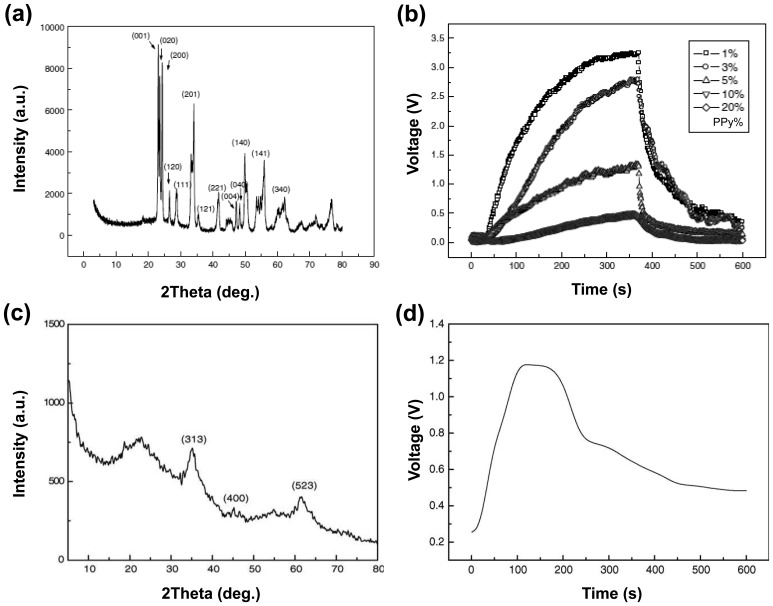
Figure 8.
(a) XRD pattern of PPy/WO3 nanohybrids and (b) their response-recovery curves to H2S at 90 °C. Adapted with permission from Ref. [49]; Copyright 2006, Elsevier B.V. (c) XRD pattern (the three peaks correspond to γ-Fe2O3 phase) of PPy/γ-Fe2O3 nanohybrids annealed at 150 °C and (d) their response curve (voltage vs. time) to 0.1% H2S at 90 °C. Adapted with permission from [50]; Copyright 2006, Elsevier B.V.

