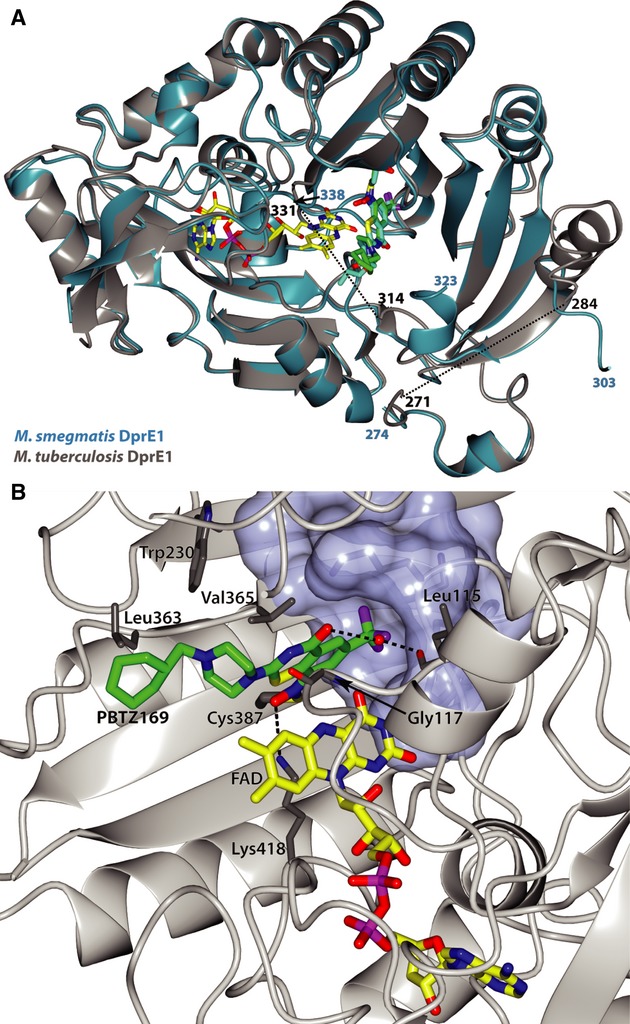
Figure 3.

- Cartoon representation of the M. tuberculosis DprE1 structure (grey) in complex with PBTZ169 adduct (green sticks), and its FAD cofactor (yellow sticks), superposed on the M. smegmatis DprE1 structure (blue) in complex with BTZ043 and FAD. The location of the disordered regions in the M. tuberculosis DprE1 are marked as black dashed lines. Residue numbers are indicated in black for the M. tuberculosis structure and in blue for the M. smegmatis protein.
- Close-up view of the M. tuberculosis DprE1 active site showing the residues in close contact with PBTZ169. The binding pocket of the CF3 group of PBTZ169 is shown as a surface representation.
