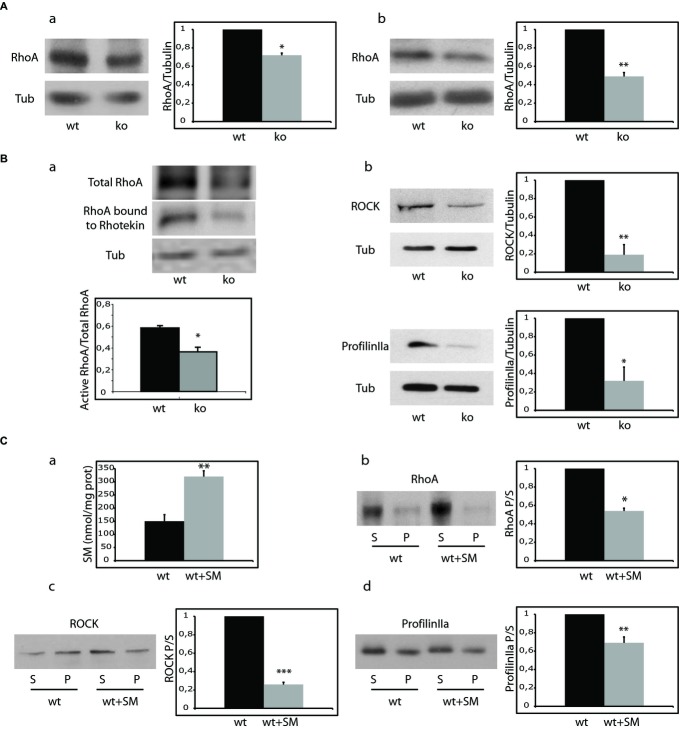
Figure 3.
- Western blot of RhoA and tubulin levels in total (a) and membrane extracts (b) from wt and ASMko synaptosomes. Graphs show mean ± s.d. of RhoA levels in ASMko conditions normalized to tubulin and referred to wt levels that were considered as 1 (n = 3, *Ptotal RhoA = 0.04, *Pmembrane RhoA = 0.008).
- (a) Activity of RhoA in wt and ASMko synaptosomes determined by the Rhotekin binding assay. Tubulin is shown as loading control. Graph shows mean ± s.d. of the ratio of Rhotekin-bound (active) RhoA to total RhoA (n = 3, *P = 0.025). (b) Western blots of ROCK, ProfilinIIa and tubulin levels in membrane extracts from wt and ASMko synaptosomes. Graphs show mean ± s.d. of ROCK (*P = 0.017) or ProfilinIIa (*P = 0.033) levels in ASMko conditions normalized to tubulin and referred to wt levels that were considered as 1 (n = 3).
- (a) SM levels (nmol/mg protein) in wt synaptosomes treated or not with SM. Graph shows mean ± s.d. in treated synaptosomes referred to non treated that were considered as 1 (n = 3, **P = 0.019). (b, c, d) Western blots of RhoA (b), ROCK (c) and ProfilinIIa (d) levels in supernatants (S) and pellets (P) after 100,000 g centrifugation of wt synaptosomes treated or not with SM. Graphs show mean ± s.d. of each protein ratio pellet/supernatant in treated samples referred to non-treated that were considered as 1 (n = 3; *PRhoASM = 0.029, ***PROCKSM = 0.0009, **PprofilinIIaSM= 0.008).

