
Figure 4.
Role of SIL1 in neuronal migration during mouse brain development.
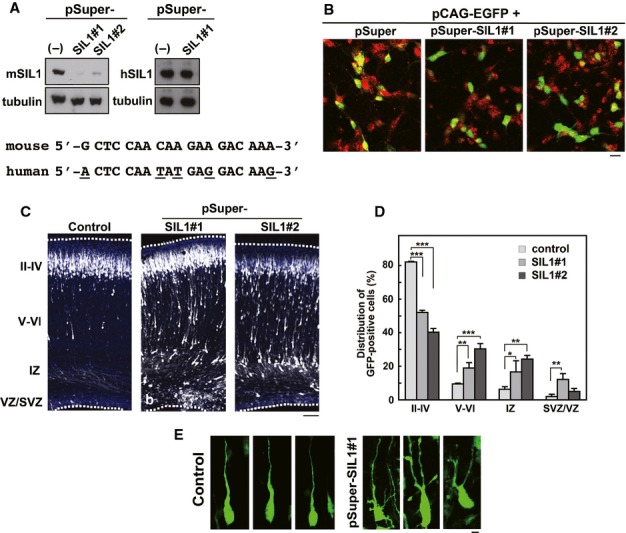
- Characterization of pSUPER-mSIL1 vectors. pCAG-Myc-mSIL1 or –hSIL1 was cotransfected into COS7 cells with control pSUPER vector (−), pSUPER-mSIL1#1 or -mSIL1#2. After 48 h, cells were harvested and subjected to western blotting with anti-Myc. Anti-β-tubulin was used for loading control. The RNAi-target sequence of pSUPER-mSIL1#1 was shown with the corresponding human sequence. Different nucleotides were marked under the human sequence.
- Knockdown of endogenous SIL1 in cortical neurons. pCAG-EGFP was transfected with pSUPER vector, pSUPER-mSIL1#1 or -mSIL1#2 into dissociated neurons obtained from the cerebral cortices at E 17 and cultured in vitro for 48 h. After fixation, cells were immunostained with monoclonal anti-GFP (green) and polyclonal anti-SIL1 (red). Note that the number of EGFP/SIL1-double positive cells decreased significantly in pSUPER-mSIL1#1- or -mSIL1#2-transfection experiments. Bars in (B) and (E), 10 μm.
- Migration defects of SIL1-deficient cortical neurons at P0. pCAG-EGFP was coelectroporated with control pSUPER vector (a), pSUPER-mSIL1#1 (b) or -mSIL1#2 (c) into cerebral cortices at E14, followed by fixation at P0. Coronal sections were stained for GFP (white) and nuclei with DAPI (blue). Dotted lines represent the pial and ventricular surfaces. Bar, 100 μm.
- Quantification of the distribution of SIL1-deficient neurons in distinct parts of the cerebral cortex (layers II–IV, layers V–VI, IZ and SVZ/VZ) for each condition shown in (C). Error bars indicate s.d. (n = 3); *P = 0.0223 (layer IZ), **P = 0.004 (layers V–VI), **P = 0.0018 (layer IZ), **P = 0.0017 (layers SVZ/VZ), ***P = 0.0001 (layers II–IV), ***P = 0.0001 (layers V–VI) by Fisher's LSD.
- Representative images of control and SIL1-deficient neurons migrating in lower CP. pSUPER vector (control)- and pSUPER-mSIL1#1-transfected cells were shown at left and right panels, respectively.
Source data are available for this figure.