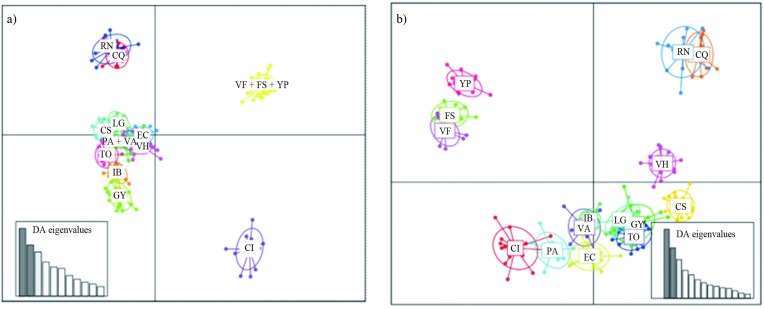
Figure 4.
Scatterplot of individuals on the two principal components of DAPC. The graph represents the individuals as dots and the groups as inertia ellipses. Eigenvalues of the analysis are displayed in inset: a) obtained with the find.clusters option, b) with clusters defined a priori according to the sampling site. Population codes are given in Table 1.

