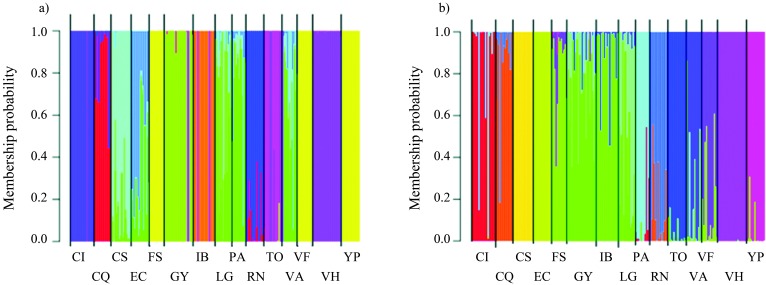
Figure 5.
STRUCTURE-like plot of DAPC analysis for a global picture of the clusters composition. Each individual is represented by a vertical colored line. Same color in different individuals indicates that they belong to the same cluster. a) K = 12, obtained with find.clusters option; b) K = 15, obtained with a priori information of sampling sites. Population Codes are given in Table 1.

