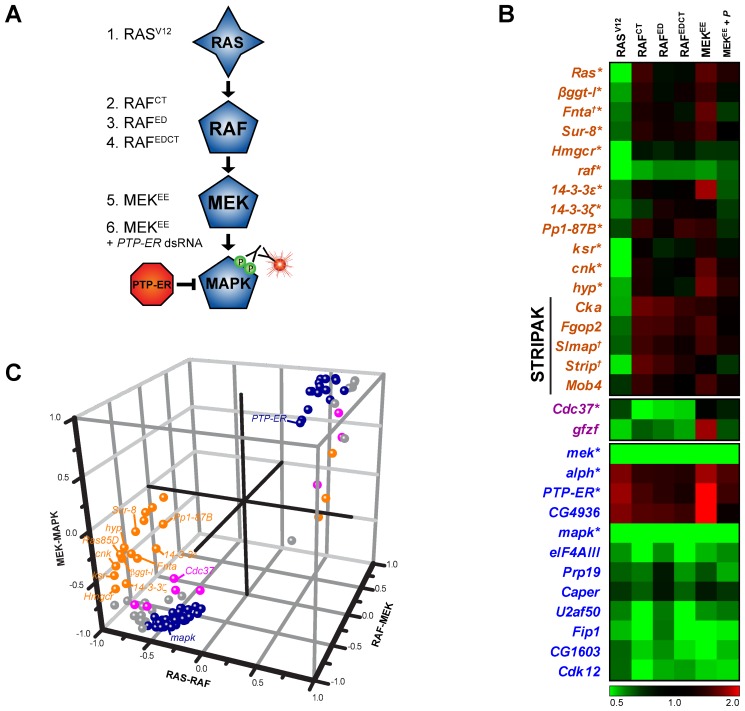
Figure 2. Epistasis analysis.
(A) MAPK pathway models depicting the secondary screen assays used to conduct the epistasis analysis. See Text S1 for full secondary assay information. (B) Epistasis screen results are shown for bona fide MAPK pathway components as well as a selection of candidates. Results are presented as pMAPK values normalized to GFP dsRNA treated controls. Bona fide MAPK pathway components are identified with an asterisk (*). Genes to which we have associated new gene symbols are marked with a cross (†). (C) Known pathway components (labeled) and experimental candidates are assigned to specific epistasis intervals. The calculated Pearson correlation r between the epistasis screen data profiles and the three predetermined profiles for epistasis intervals (see Methods) are represented on three axes (x-axis, RAS-RAF; y-axis, MEK-MAPK; z-axis, RAF-MEK). Values near 0 represent poor correlation while values near 1 (negative regulators) or −1 (positive regulators) indicate high correlation with a given epistasis profile. Candidates were assigned to the RAS-RAF (orange), RAF-MEK (magenta), or MEK-MAPK (dark blue) interval on the basis of the highest distance value. Candidates that could not be assigned to a specific interval (distance values within [−0.5, 0.5]) are shown in grey. Detailed epistasis screen results are available in Table S3.

