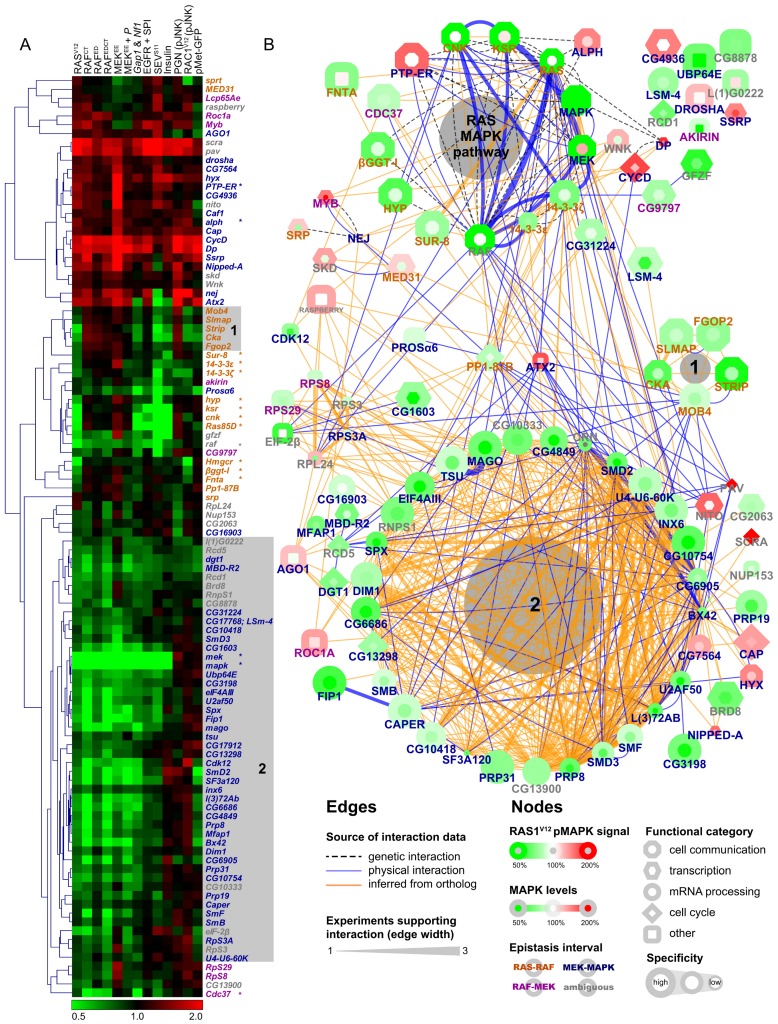
Figure 3. Predicted protein complexes have similar secondary screen functional profiles.
(A) Unsupervised hierarchical clustering of secondary screen results. The 13 secondary assays are listed at the top of the clustering diagram. Bona fide MAPK pathway components are identified with an asterisk. (B) Protein interaction network (PIN) assembled using interaction data from Drosophila and homologs from other species. Edge color represents the source of the interaction data and edge width denotes the number of distinct experimental evidences for a given interaction. The coloring of the node border represents RASV12 screen results while the coloring of the node center reflects MAPK protein levels. Node shapes reflect the functional category of the hits and specificity results are represented by the size of nodes. In both panels, epistasis results are represented by the coloring of gene symbols in orange (RAS-RAF), magenta (RAF-MEK), dark blue (MEK-MAPK), or grey (ambiguous). MAPK pathway components, STRIPAK (shaded area 1) and splicing factors (shaded area 2) group together in both the clustering analysis and PIN. Note that the full name is used for the gene raspberry, instead of ras, to avoid confusion with Ras85D.

