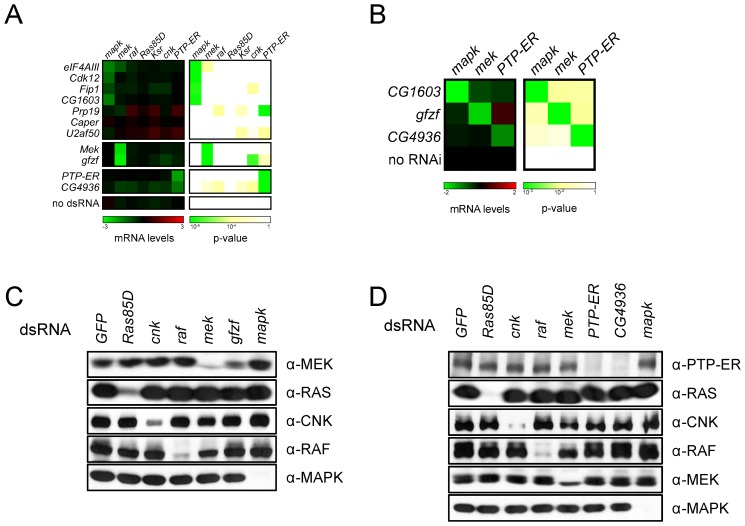
Figure 4. Screen candidates modify the expression of RAS/MAPK components.
(A) The transcript levels of RAS/MAPK components are altered by the depletion of some candidates. All candidates were tested in an initial qPCR secondary screen; the results shown here are from a separate qPCR confirmation experiment (see Text S1). The left panel shows transcript levels for the RAS/MAPK components listed on the top following treatment with the indicated dsRNAs (labels to the left). mRNA levels are expressed as log2 ratios of GFP dsRNA treated controls. The right panel shows the associated p-values (unpaired two-tailed Student's t-test). dsRNA targeting gfzf had a similar effect to the mek dsRNA with a −2.86 reduction in mek transcript levels (p-value, 4.2×10⁻⁸). CG4936 dsRNA caused a −1.37 reduction in PTP-ER transcript levels (p-value, 1.2×10⁻⁸), which was slightly weaker than the −1.88 reduction (p-value, 3.0×10⁻⁹) measured for the PTP-ER dsRNA. Cdk12, Fip1, and CG1603 dsRNAs behaved similarly to eIF4AIII dsRNA, used as a control for mapk transcript depletion, with mapk transcript levels <−0.75 and a p-value<1×10⁻⁴. (B) In vivo RNAi experiments confirm cell culture qPCR results. Hairpin RNAi constructs were expressed in larvae under the control of a heat shock-inducible flip-out actin promoter. qPCR experiments were performed on L3 eye disc lysates. mRNA levels are expressed as log2 ratios of a no RNAi control (flies carrying the flip-out promoter without a RNAi construct). Results were similar to those in cell culture qPCR experiments in (A): CG1603 RNAi caused a reduction in mapk levels (−2.06; p-value, 5.3×10⁻⁴), gfzf RNAi reduced mek levels (−1.66; p-value, 5.4×10⁻⁴), and CG4936 reduced PTP-ER levels (−1.06; p-value, 5.7×10⁻⁴). (C and D) The levels of RAS/MAPK pathway components in S2 cells were evaluated by Western blot with the indicated antibodies (labels to right of panel) following treatment with the indicated dsRNA reagents (top labels). (C) Mirroring the qPCR data, a specific depletion of MEK levels was observed in gfzf dsRNA treated cells. (D) Also in agreement with the qPCR data, a specific decrease in PTP-ER levels was observed upon depletion of CG4936.

