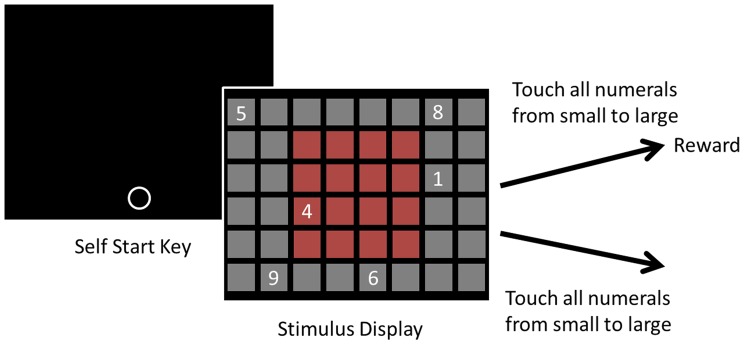
Figure 1. Schematic diagrams of the number sequence task.

The subject's touch on the white open circle initiated a trial and random number (from 4 to 9) of Arabic numerals (baseline trials) or two numerals, 1 and 9 (test trials) were presented on the monitor. In test trials, 1 and 9 were located on the same row (either 1 on the left or 9 on the left); in baseline trials, stimuli were presented at random locations. The grid arrangement for stimulus presentations were depicted in Stimulus Display. Each grid was 130×130 pixels with a 20-pixel margin to the next grid. 4×4 grids in red were used for stimulus presentation in test trials.
