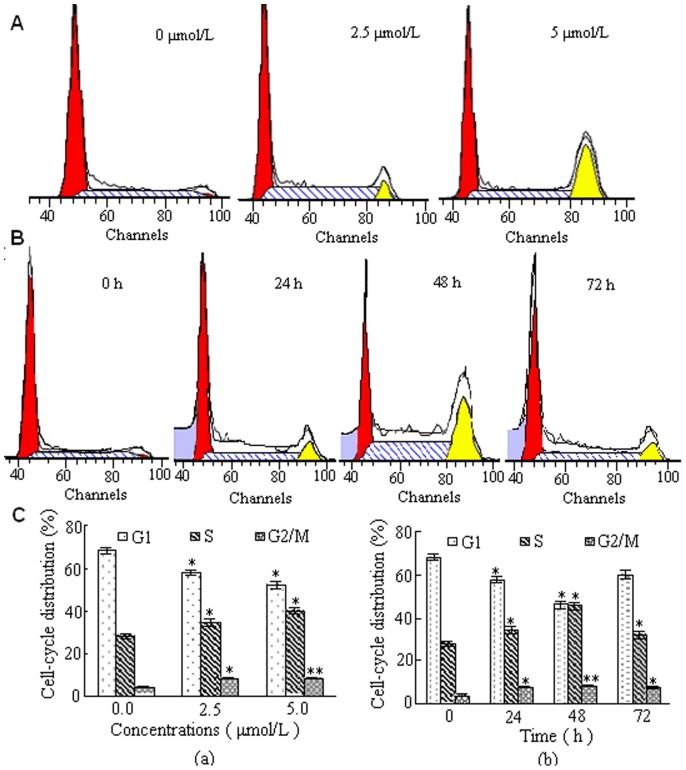
Figure 4. Effect of DBDFT on the cell cycle distribution of SGC-7901 cells.
A Cells treated with 0.0, 2.5 and 5.0 µmol/L DBDFT for 24 h were collected and processed for analysis. B Cells treated with 2.5 µmol/L DBDFT for different time was collected and analyzed. C The percentages of the cell population in each phase (G1, S, and G2/M) of cell cycle were analyzed during DBDFT treatment. (a) 24 h, (b) 2.5 µmol/L.

