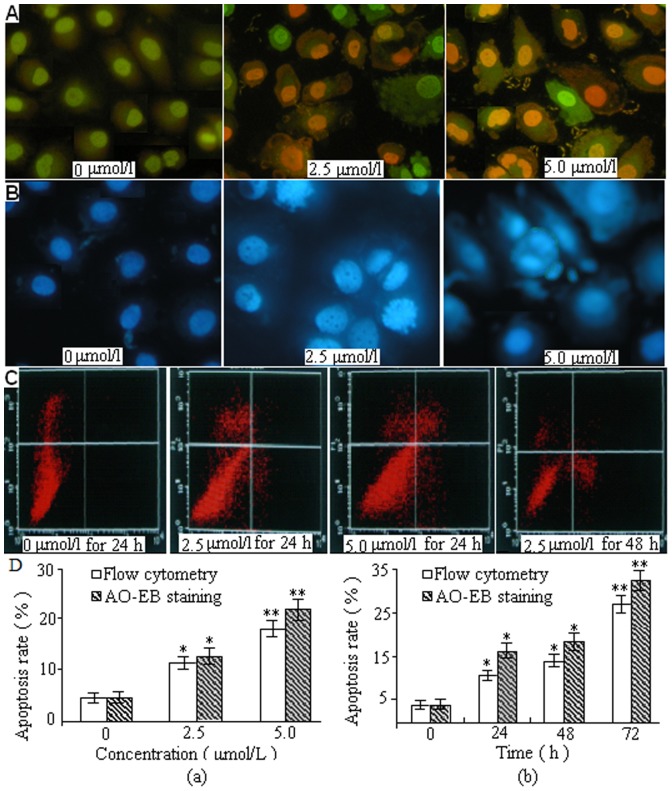
Figure 5. Representative images of DBDFT-induced apoptosis detection.
A Morphological observation of fluorescence microscope with AO/EB double staining. B Cell apoptosis morphological changes were examined by Hoechst 33258 staining and observed under fluorescence microscope. C AnnexinV/PI dual-immuno- fluorescence staining after treatment with DBDFT (0, 2.5 and 5 µmol/L) for different time revealed significantly increased number of apoptotic and necroticcells (measured with Annexin V+/PI+ cells). Percentages of each phase were calculated during the course of DBDFT treatment. Values are means±SD of 3 independent experiments. The asterisks indicate significant differences between the control and DBDFT-treated groups, *p<0.05; **p<0.01. *p<0.05 was considered significant.

