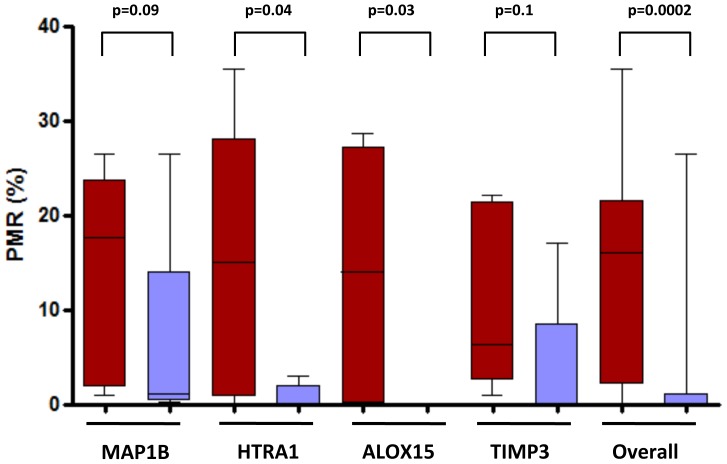
Figure 2. Technical validation of Infinium methylation data using Methylight assays.
Four genes (MAP1B, HTRA1, ALOX15, TIMP3) were selected based on strict criteria (β value in solitary tumors <0.2; β value >0.3 in multiple tumors; difference in β value between multiple versus solitary ≥0.2; and an adjusted p value<0.05). Box-plots display the Percentage Methylation Ratio (PMR) determined by Methylight. The lines inside boxes denote median, and boxes mark the interval between the 25th and 75th percentiles. Black lines denote the highest and lowest PMR value. P values for the comparison between multiple (red) and solitary (blue) tumors (Mann-Whitney test) are shown.

