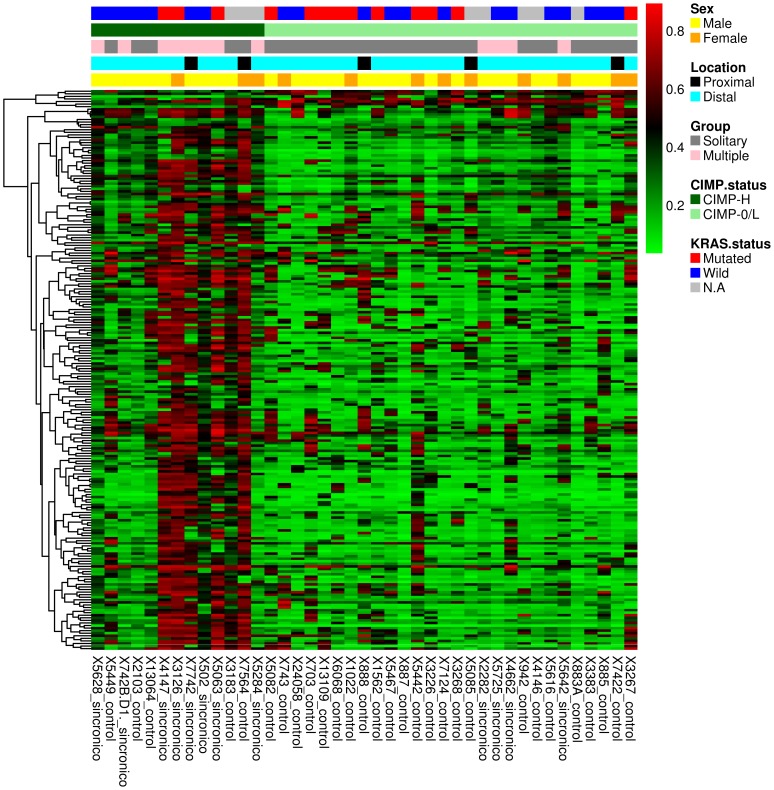
Figure 3. Heatmap showing the 218 most significantly hypermethylated CpG sites that differentiate CIMP-H (n = 13) and CIMP-0/L tumors (n = 28) based on the Infinium DNA methylation data.
The DNA methylation β-values are represented by using a color scale from red (high DNA methylation) to green (low DNA methylation). Rows represent probes and columns represent tumor samples. Clinical and molecular features (group, gender, tumor location, CIMP-H and KRAS mutational status) are represented above the heatmap with horizontal bars.

