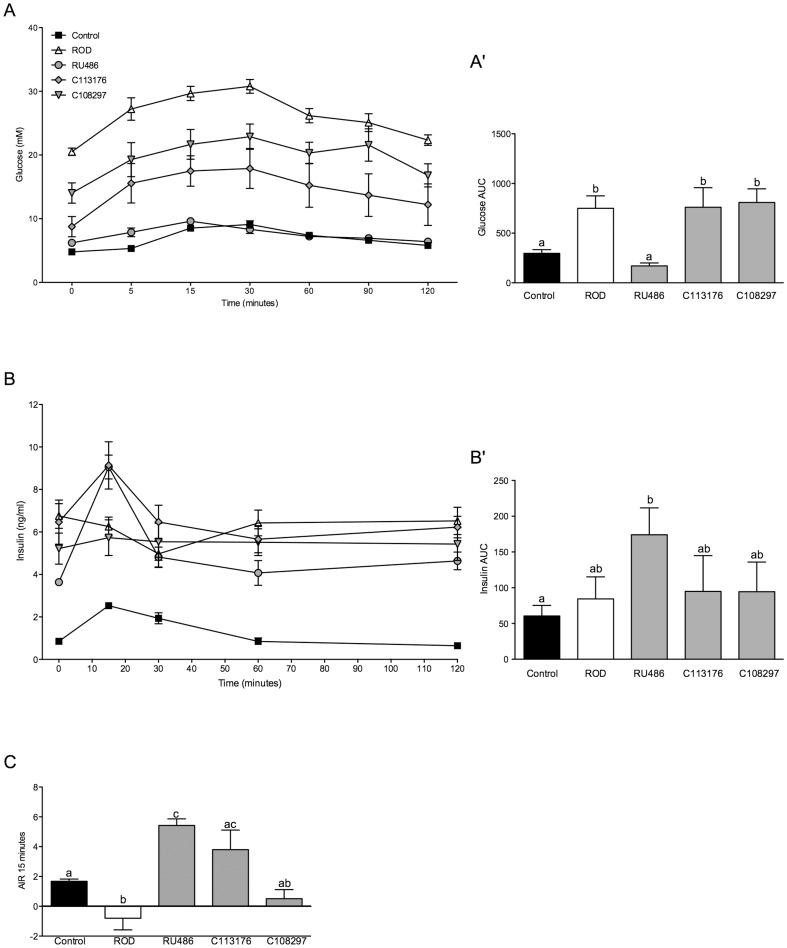
Figure 2. Glucose intolerance and acute insulin response (AIR) is improved with RU486 and C113176 treatment.
Fasting (basal, 0 minutes) and stimulated blood glucose levels (mM) were measured at 5, 15, 30, 60, 90 and 120 minutes post oral glucose gavage (A). Glucose area under the curve (AUC) was calculated based on fasting blood glucose of individual animals (A′). Fasting (basal, 0 minutes) and glucose-stimulated insulin levels (ng/ml) were measured at 15, 30, 60, and 120 minutes post oral glucose gavage (B). Insulin area under the curve (AUC) was calculated based on fasting individual insulin levels within each group (B′). To measure insulin capacity acute insulin response (AIR) was measured by the difference in insulin levels between fasting insulin and 15 minutes post glucose gavage (C). Negative values represent a decrease in insulin response, indicating impairment in insulin secretion. Bars that do not share similar letters denote statistical significance, p<0.05, one-way ANOVA using Tukey's post-hoc. A student's unpaired t-test was performed between controls and ROD, C108297 and C113176 groups (C). n = 7–10. All values are means ± SE.

