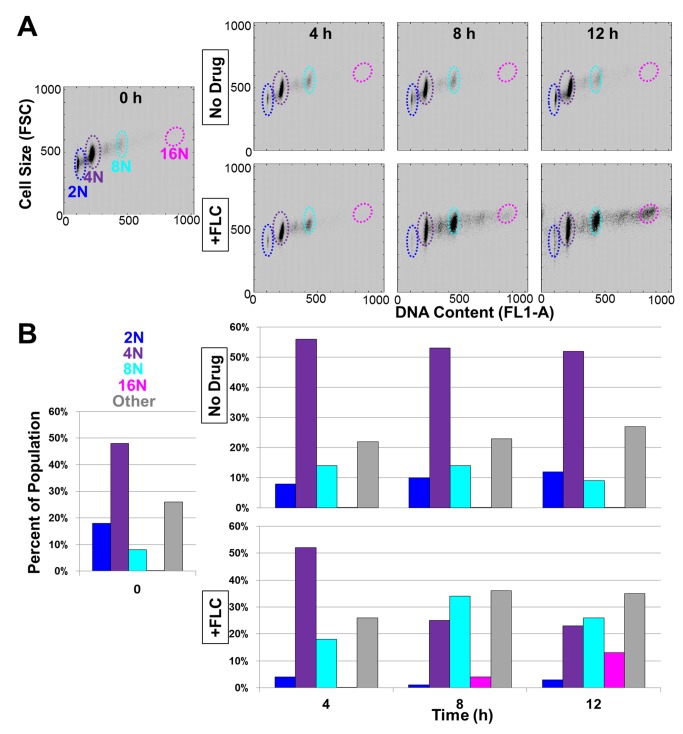
Figure 1. Cell size correlates with DNA content.
(A) Flow cytometry data plotted as cell size (FSC) versus DNA content (FL1-A) for cultures grown in the absence (top row) or presence (bottom row) of FLC for times indicated. (B) Bar graphs represent percent of cells that fell into colored regions defined in scatterplots above as determined using Gaussian fitting (see Materials and Methods).

