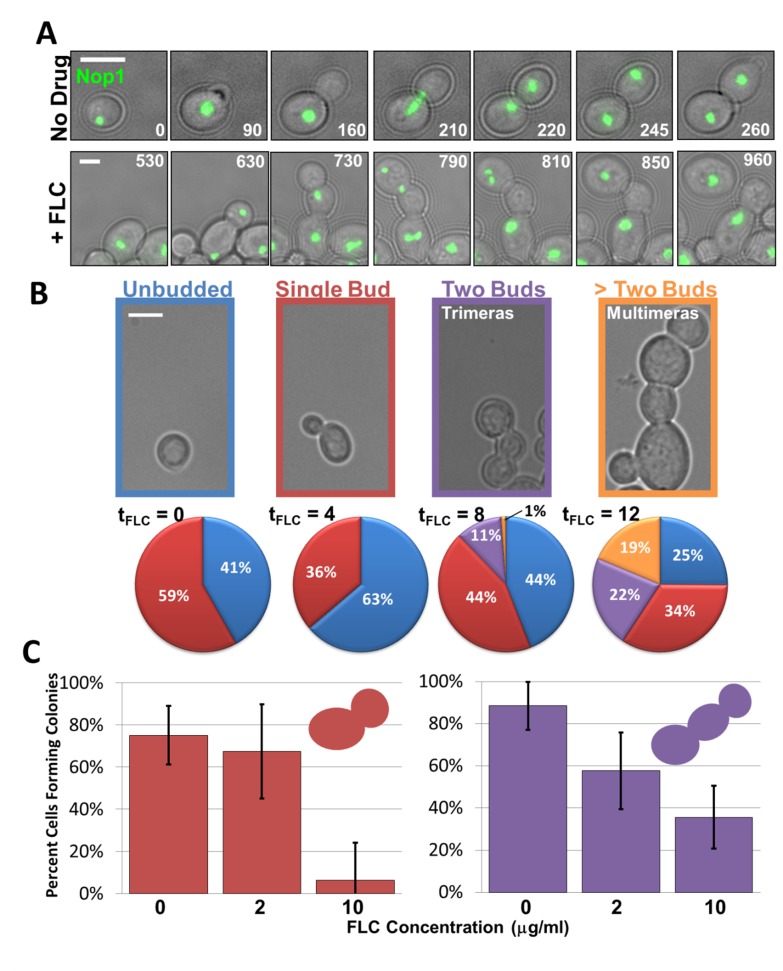
Figure 4. Trimeras become prevalent after 8 h of FLC exposure and remain viable.
(A) Time-lapse microscopy of control (top row) and FLC-exposed cells expressing Nop1-GFP. Numbers indicate time (min) of FLC exposure. (B) Relative proportion of cells with indicated morphologies (indicated in color-outlined images) at different times (t, time) of FLC exposure. “No drug” control cultures showed no significant deviation from t = 0 numbers (unpublished data). Colors in pie charts correspond to color of image outline. Scale bars, 5 µm. At least 300 cells from each of two different strains were analyzed for each time point. (C) Colony formation assay following cell micromanipulation. Following 12 h pre-exposure to 10 µg/ml FLC, single budded cells (red) and trimeras (purple) were transferred to plates with indicated FLC concentration. The number of cells analyzed for single budded cells on 0, 2, and 10 µg/ml FLC plates were 52, 53, and 48, respectively. The number of trimeras analyzed on 0, 2, and 10 µg/ml FLC plates were 78, 65, and 48, respectively. Error bars indicate standard error, and statistical significance was determined using a Fisher's exact test.

