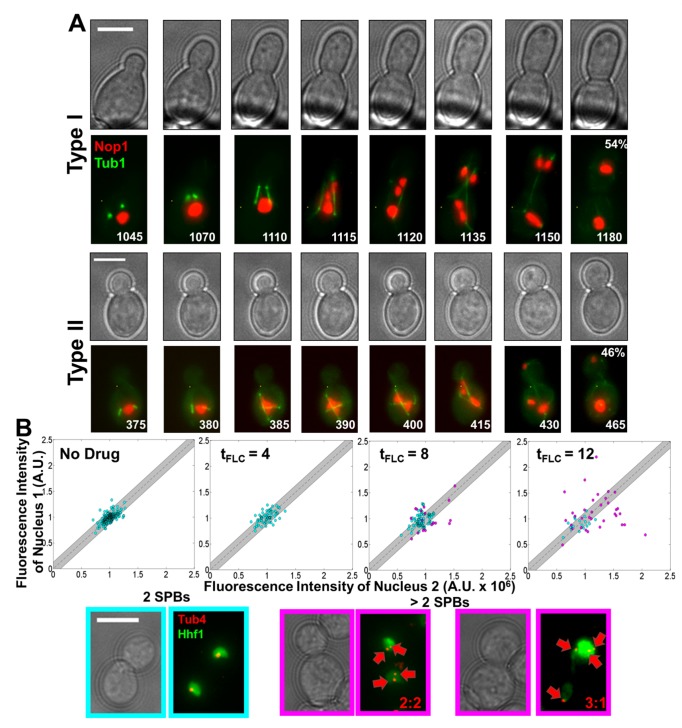
Figure 6. Unequal segregation occurs in nuclei with more than one spindle.
(A) Time-lapse microscopy of nuclear segregation patterns in tetraploid/diakaryotic cells. Type I segregation pattern (top two rows, 54% of events), both spindles elongated across the bud neck. Type II (bottom two rows, 46% of events), only one spindle elongated across the bud neck. Numbers denote time (min) of FLC exposure. Scale bars, 5 µm. Total of 13 cells analyzed. (B) Histone H4 (Hhf1)-GFP fluorescence intensity scatter plots. Sister nuclei are plotted relative to each other. Postanaphase cells containing a total of two SPBs (cyan) clustered around 1∶1, indicative of equal segregation (gray region, contains 95% of points from “no drug” cells). Postanaphase cells containing more than two SPBs (magenta) diverged significantly from 1∶1 at 12 h (two-tailed t test, p value <0.05).

